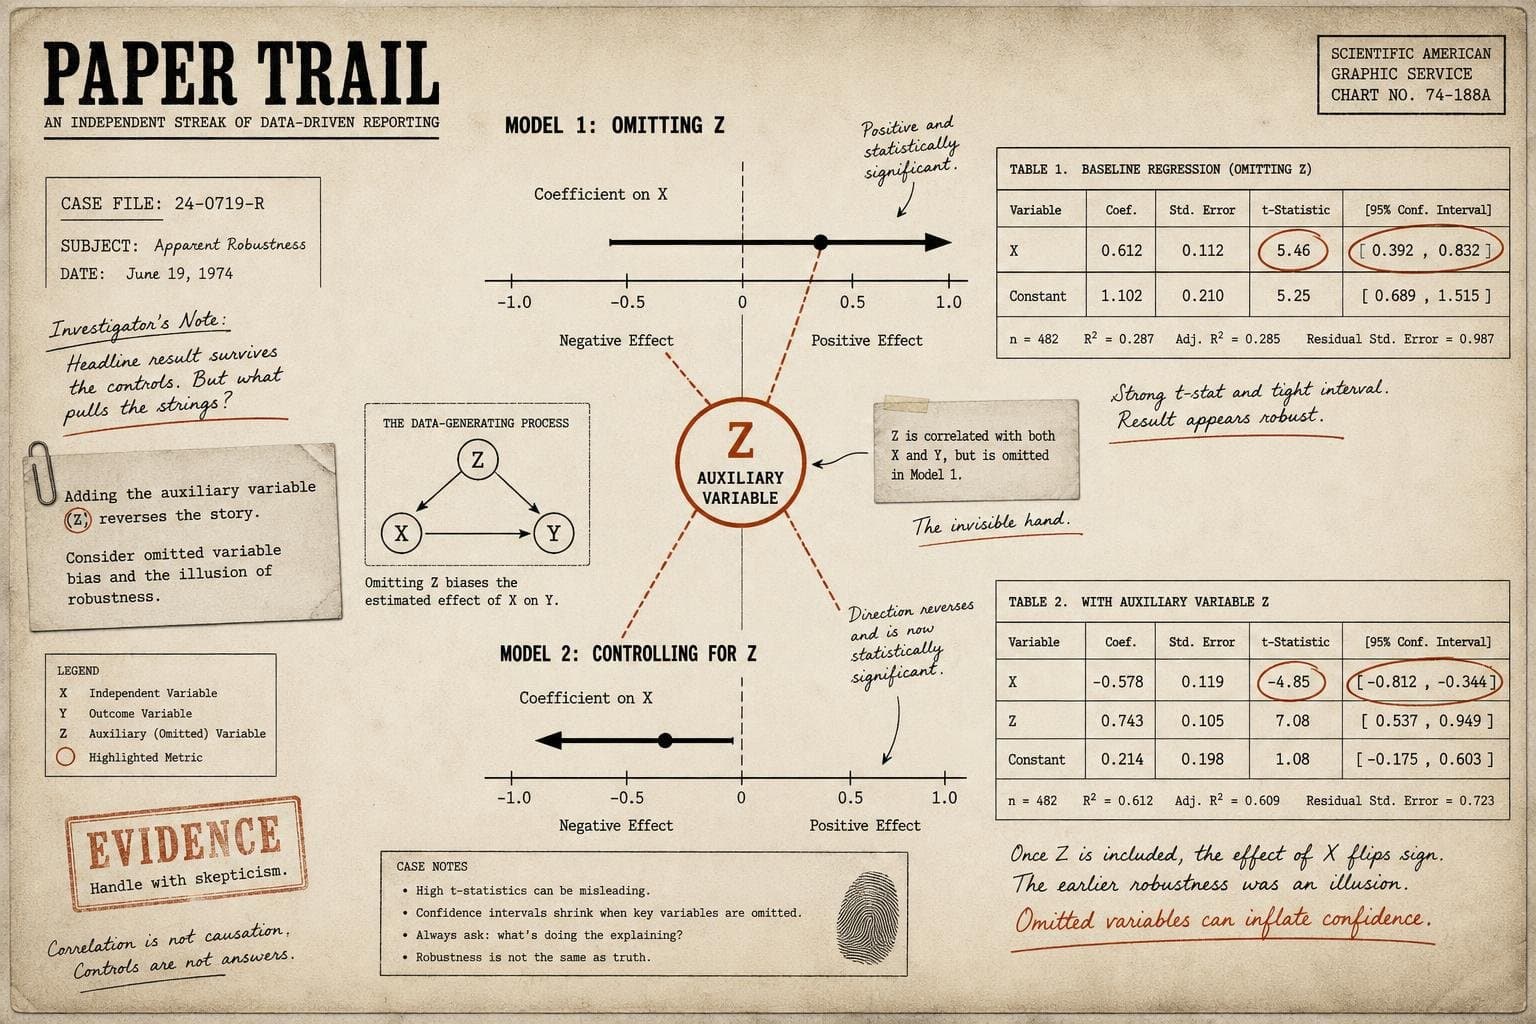

There's a version of p-hacking that everyone in research methods knows about: run your analysis twenty different ways, report the one that clears p < 0.05, and call it a day. It's crude, it's common, and it's been discussed extensively in the replication literature. But a paper posted to arXiv this month describes a more sophisticated variant — one that doesn't just fish for significance, but can actually reverse the direction of a finding while simultaneously inflating the statistics that are supposed to validate it.
The technique has a name now: SHAVE, for Sign Hacking with Auxiliary Variable Exploration. The researchers behind it, based at Tsinghua University's Yau Mathematical Sciences Center, show that in high-dimensional regression — the kind increasingly common in clinical and epidemiological research, where you have many candidate variables and relatively fewer observations — a researcher can manipulate the sign of a coefficient by strategically including an auxiliary variable. Not just nudge an effect size. Flip the direction of the finding entirely.
The Mechanics Are Elegant, and That's the Problem
Here's the core result. In a standard linear regression, the sign of a coefficient tells you the direction of an effect: does this drug increase or decrease the outcome? Does this exposure help or harm? The SHAVE paper demonstrates that when many auxiliary candidate variables are available — as they routinely are in large clinical datasets — there exists, with positive probability, at least one variable whose inclusion will reverse the sign of the coefficient you care about. And crucially, this reversal comes packaged with inflated t- and F-statistics, meaning the manipulated result looks more statistically robust than the original.
The authors aren't describing a theoretical curiosity. They run simulation studies and an empirical application that corroborate the theoretical findings. The mechanism is related to a long-known phenomenon in statistics — omitted variable bias — but SHAVE operationalizes it as a deliberate search strategy in the age of big data, where the abundance of candidate covariates makes such searches trivially easy to conduct and nearly impossible to detect from the outside.
The policy implications they flag are pointed. The Environmental Kuznets Curve — the model describing the relationship between economic growth and environmental degradation — is one of their illustrative examples. Whether that curve is U-shaped, inverted U-shaped, or linear depends entirely on the signs of polynomial coefficients. Different sign estimates have led to fundamentally different policy conclusions about whether growth eventually helps or continues to harm the environment. If those sign estimates are manipulable through auxiliary variable selection, the empirical foundation for those policy debates is shakier than anyone has acknowledged.
This Connects to a Broader Methodological Failure Mode
The SHAVE finding lands in a context that regular readers here will recognize. We've spent time this year on underpowered studies, on adaptive preregistration as a cover for post-hoc analysis, on the gap between what statistical significance means and what it's treated as meaning. SHAVE is a different mechanism, but it feeds the same underlying problem: the tools researchers use to validate findings can be gamed in ways that produce more convincing-looking results, not less.
What makes this variant particularly insidious is that it doesn't require a researcher to consciously intend manipulation. The same behavior — exploring which auxiliary variables to include in a model, iterating on model specification, trying to "improve" a regression — is also what conscientious researchers do when they're genuinely trying to control for confounders. The difference between careful model building and SHAVE is intent and documentation, neither of which is visible in a published paper.
This is precisely the problem that surfaces when you look at how clinical evidence actually gets synthesized. A meta-epidemiological study in BMC Medicine examining systematic reviews published between 2017 and 2024 found that reviews combining randomized and non-randomized studies frequently drew conclusions without adequately addressing conflicting findings across study designs — and that 72.5% of reviews that pooled both study types included non-randomized studies at moderate or high risk of bias. When the underlying model specifications feeding those studies are themselves manipulable, the compounding effect on evidence synthesis is considerable.
The authors do propose detection strategies, which is the constructive contribution here. When augmented or independent datasets are available, certain patterns of sign instability across specifications can flag potential SHAVE. But that detection requires data sharing and methodological transparency that the research community has struggled to enforce consistently.
What to Watch For
The SHAVE paper is a preprint, posted July 5. It hasn't cleared peer review yet, and the detection strategies it proposes will need independent evaluation. Consider it alongside recent work on permutation testing in small clinical trials — a biostatistician's examination of the eteplirsen trial, which showed that a parametric analysis of 12 patients produced a non-significant result (approximate two-sided p-value of 0.56 for the key comparison), while the permutation test Fisher's framework actually prescribes would have changed the terms of the regulatory debate entirely. The throughline in both cases: the choice of analytical framework isn't neutral, and in small or high-dimensional datasets, that choice can determine not just the magnitude but the direction and apparent robustness of a finding.
The practical question SHAVE raises for anyone reading clinical research: when a paper reports a surprising directional finding — this intervention reduces risk rather than increases it, this exposure protects rather than harms — and that finding emerges from a high-dimensional dataset with many covariates, the model specification deserves as much scrutiny as the p-value. Consider, for instance, how a polypill trial recently published in Nature Medicine reported its primary outcome: a between-group difference in ejection fraction of 3.3 percentage points, with a 95% confidence interval of 0.2 to 6.4. That's a real result, transparently reported, with the uncertainty visible. The confidence interval does the work it's supposed to do. The sign of a coefficient is supposed to be the most basic, interpretable output of a regression. The fact that it can be engineered to point whichever direction a researcher finds convenient, while the statistics wave it through, is a problem that no threshold adjustment fixes — and one that transparent reporting of model specifications, not just outcomes, is the only real defense against.


