


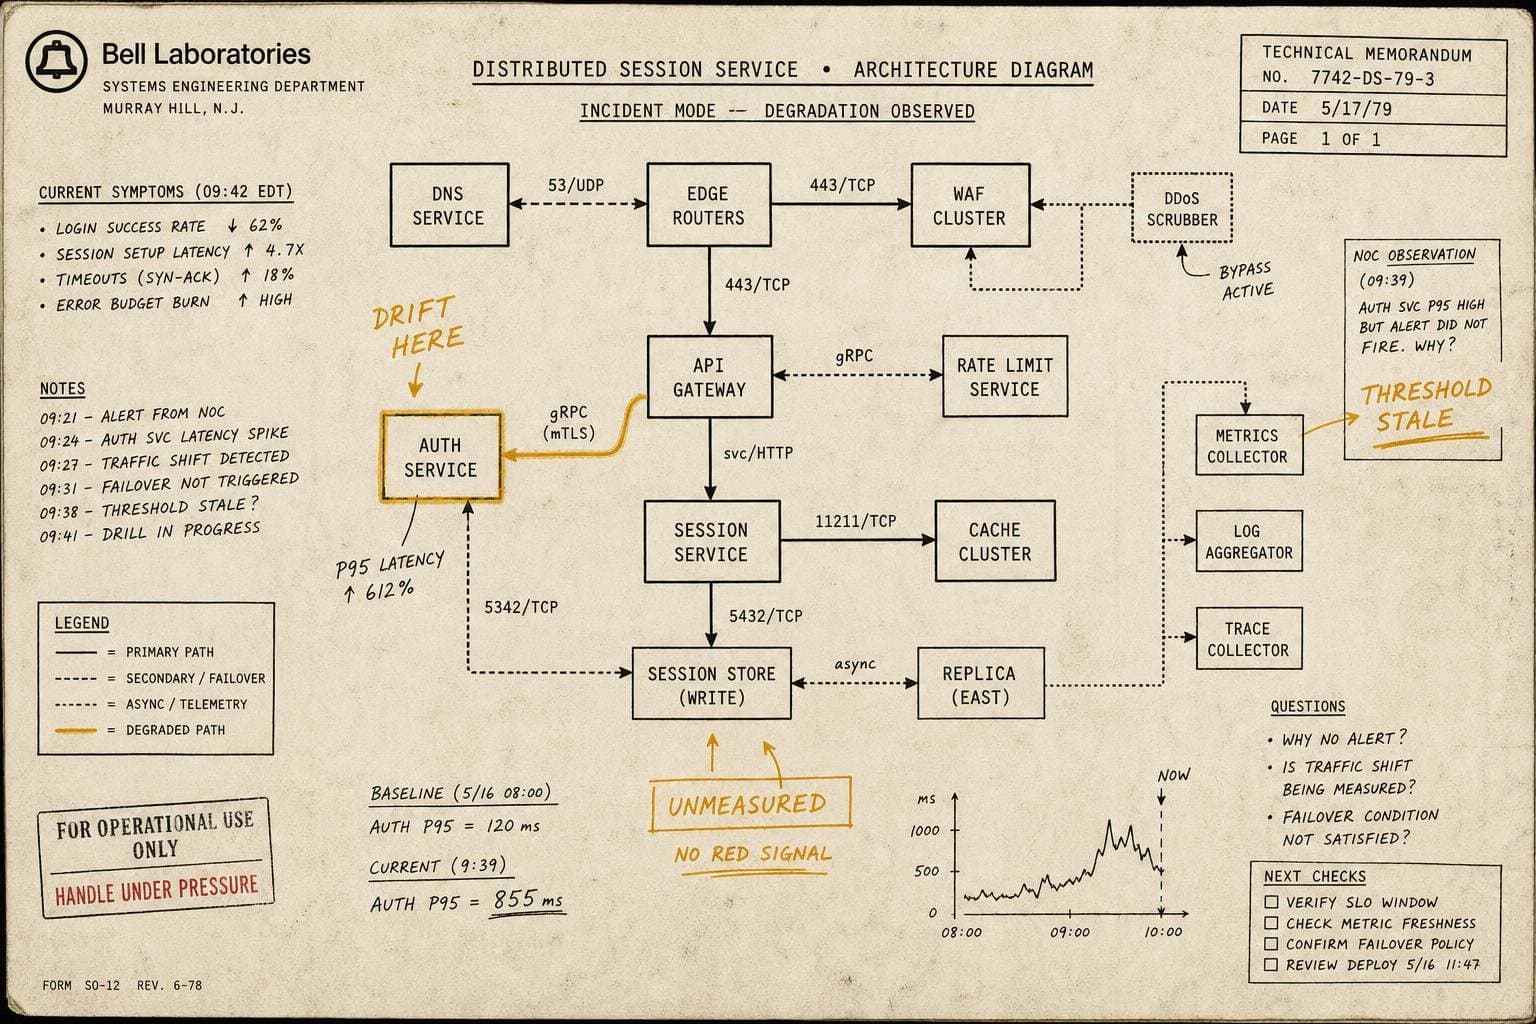

There's a particular kind of confidence that comes from a dashboard that's never been wrong. You built it eighteen months ago, it's been green ever since, and during incidents you glance at it and feel reassured. That reassurance is the problem.
The monitoring you trust most tends to be the monitoring you set up earliest — which means it was designed for a system that no longer exists, by a team that understood different failure modes, measuring things that mattered before the last three major refactors. It's not wrong, exactly. It's just answering a question nobody is asking anymore.
Old Monitors Drift Toward Theater
Systems change continuously. Monitoring changes only when someone has time, which means never, or when something breaks badly enough to force it, which means too late. The gap between what your production system actually does and what your monitoring thinks it does widens quietly, one deployment at a time.
The tell is usually subtle: alerts that fire but resolve before anyone investigates, dashboards that look healthy during incidents that are clearly not healthy, thresholds that were set based on traffic patterns from a year ago and haven't been touched since. None of these are obviously broken. They're just measuring the ghost of a previous system.
This is distinct from alert fatigue, which I've written about before in the context of alerts that fire too often. The failure mode here is different and arguably worse: monitoring that fires at the right frequency but is watching the wrong thing. It passes every operational review because the numbers look reasonable. It just doesn't tell you what's actually happening.
The organizational mechanism that produces this is straightforward. When you're building a new service, monitoring is a first-class concern — you think carefully about what matters, you instrument the critical paths, you set thresholds with intention. Then the service ships, the team moves on, and the monitoring becomes infrastructure: assumed, inherited, rarely questioned. New engineers learn to read the existing dashboards rather than asking whether the dashboards are reading the right things.
The Audit Nobody Schedules
The fix is not technically complicated. It's organizationally uncomfortable.
Monitoring needs to be audited against the current system, not the system that existed when it was written. That means sitting down with the actual codebase, the actual traffic patterns, and the actual failure modes your team has encountered in the last six months, and asking: if this thing broke in the way it actually breaks, would we know?
The answer is usually "mostly, but with gaps." The gaps are what matter. They tend to cluster around a few patterns:
New dependencies that aren't monitored. Every time you add a third-party service, a new database, or an internal microservice dependency, you're adding a failure mode. If you didn't add monitoring when you added the dependency, you're flying blind on that path. The dependency you don't know about is the one that will kill you — but the dependency you know about and aren't watching is almost as dangerous.
Thresholds that were set for old traffic. A p99 latency threshold that made sense at 10,000 requests per minute may be completely wrong at 100,000. A memory threshold calibrated for a monolith may be irrelevant after a decomposition into services. These thresholds don't fail dramatically; they just stop being meaningful.
Metrics that measure activity instead of health. Request count is not a health metric. CPU utilization is not a health metric. These are activity metrics — they tell you something is happening, not whether it's working. The drift toward activity metrics is natural because they're easy to instrument, but they're poor proxies for what users actually experience.
The audit should be a scheduled event, not a reaction to an incident. Quarterly is a reasonable cadence for most teams; more frequently if you're deploying major architectural changes. The output should be a concrete list of monitoring gaps, not a general sense that things are probably fine.
What "Current" Actually Means
The goal is monitoring that reflects the system you're running today, not the system you designed two years ago. That's a moving target, which is the point — it requires ongoing attention rather than a one-time setup.
Practically, this means treating monitoring as a deliverable in the same way you treat tests or documentation. When a service changes significantly, monitoring changes with it. When a new dependency is added, monitoring for that dependency is part of the definition of done. When a postmortem reveals a gap, closing that gap is a tracked action item, not a vague intention.
The teams that do this well tend to share one habit: they read their own dashboards during non-incident periods, with the specific goal of asking whether what they're seeing makes sense. Not "is everything green" but "does this accurately represent what the system is doing right now." That question, asked regularly, surfaces drift before it becomes a crisis.
The monitoring that's never been wrong might just be the monitoring that's never been tested against the right failure. The difference matters at 3am, when you're staring at a green dashboard and something is clearly on fire.