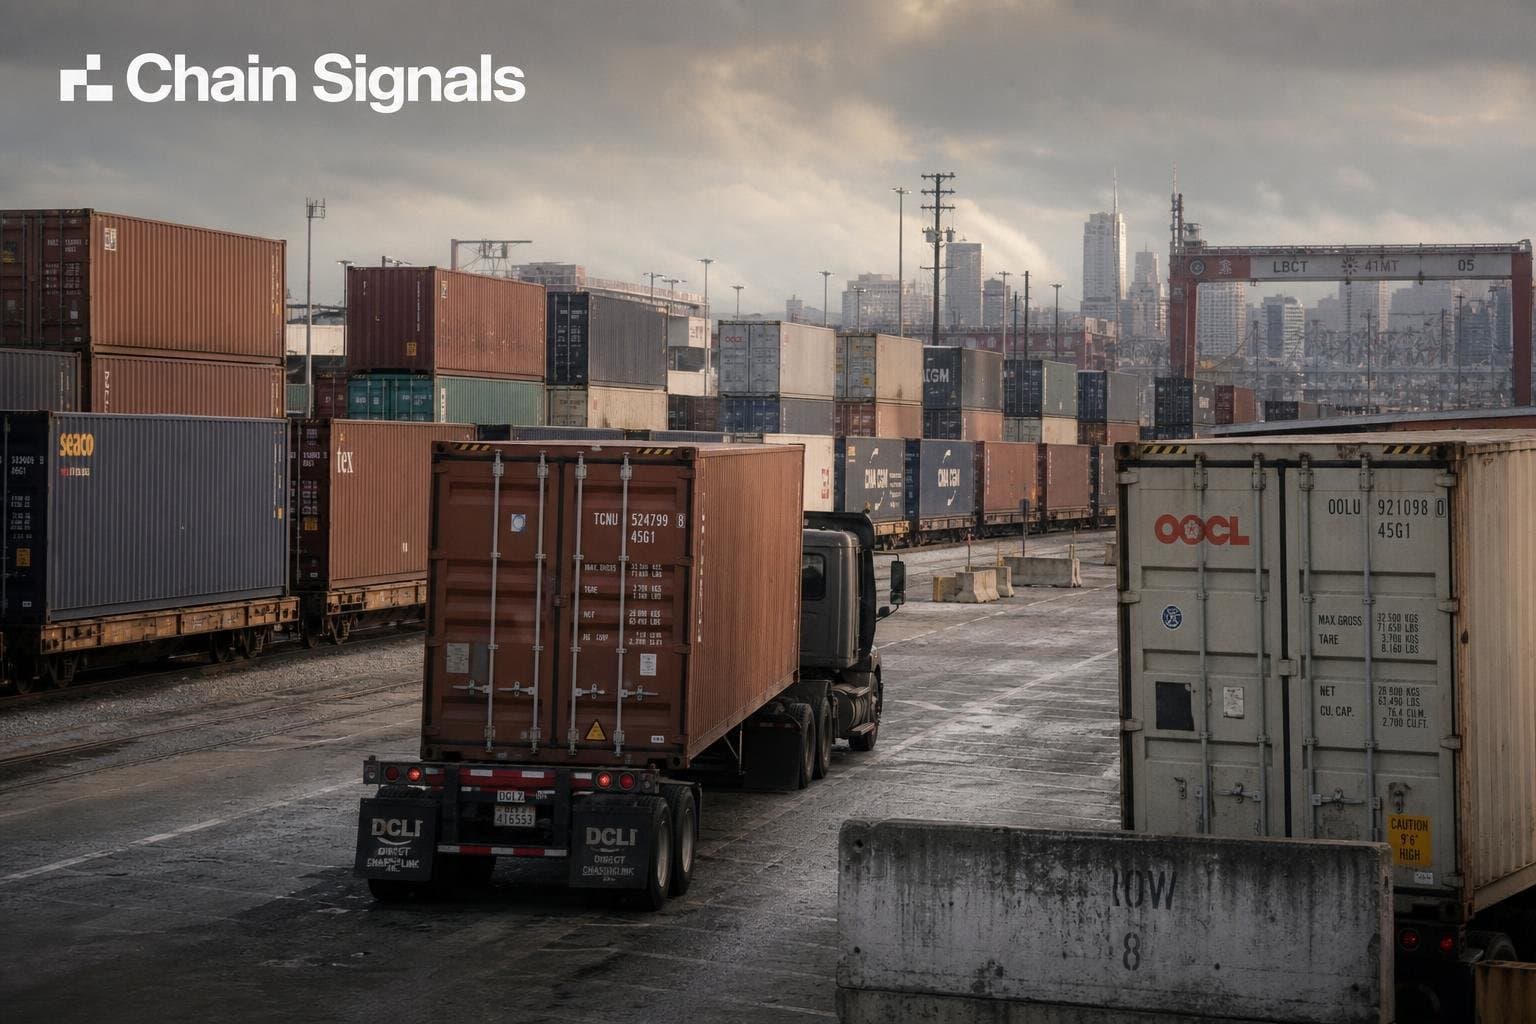

The intermodal boom has a dirty secret: the cargo is moving fine until it isn't, and the place it stops moving is the last mile between the port gate and the inland distribution center. That's where dwell time accumulates. That's where the announced capacity numbers and the operational reality part ways.
Intermodal demand is surging, but drayage capacity is tight — that's the operational summary from STG Logistics CEO Geoff Anderman, and it's the most useful sentence in the current market. The surge is real. The constraint is in the drayage layer, not the vessel layer. And when drayage capacity tightens, containers don't move off port. They sit. Dwell time climbs. And the port's announced throughput capacity becomes increasingly theoretical.
Long Beach Is Working the Backlog. The Backlog Exists Because Inland Is Full.
LBCT is working around the clock to thin a backlog of intermodal containers — that's the Journal of Commerce's framing, and the operational detail matters. The terminal is running extended hours specifically to move intermodal boxes. That's not a routine throughput story. That's a terminal responding to a backup that has already formed.
The question worth asking: where does the container go after it leaves the terminal? If inland distribution centers are at or near capacity, moving the box off the port doesn't solve the problem — it relocates it. The container sits at a rail ramp or a warehouse yard instead of a marine terminal, and the dwell clock keeps running in a different column. The port's numbers look better. The system's numbers don't.
This is the distinction that gets lost in port throughput reporting. "Containers moved off terminal" is a real metric. It is not the same as "containers delivered to final destination." The gap between those two numbers is where the actual constraint lives right now, and it's being driven by the same dynamic Anderman described: intermodal demand is up, drayage capacity hasn't kept pace, and the inland end of the chain is absorbing the pressure.
Rates Are Telling the Same Story from the Other Direction
Average Rotterdam to New York container freight rates have risen 80% since March, per Lloyd's List, driven by capacity cuts and front-loading ahead of expected US tariff increases. Westbound bookings have recently reached their highest level in more than a year. On the trans-Pacific side, strong peak demand is pumping trans-Pac box rates, with a rare stable moment in the US tariff regime likely boosting demand.
More cargo moving faster into US gateways, against a backdrop of tight drayage and strained inland distribution capacity, is a pressure equation with a predictable output. The vessels are delivering. The inland network is the constraint. And boxship charter rates continue to rise as 2026 vessel availability remains critically limited — which means the inbound volume pressure isn't going to ease on its own. Shipowners hold the bargaining power. Carriers are locking in capacity through 2027 and beyond. The pipeline stays full.
For procurement teams, this is the part that matters: the rate environment is being driven by vessel-side tightness and demand pull, but the operational pain is accumulating at the inland end. You can negotiate ocean rates all day. If your DC is at capacity and your drayage provider can't find drivers, the box sits.
What to Watch in the Next 30 Days
The BTS Freight Analysis Framework benchmark release from July 31 gives updated commodity flow estimates by mode and origin-destination pair through 2022 — useful baseline context, but it won't tell you what's happening at a Long Beach intermodal terminal this week. For that, the leading indicators are dwell time by terminal (not port-wide averages), rail ramp utilization at inland hubs, and drayage spot rates in the LA/Long Beach basin. When drayage spot rates spike relative to contract rates, that's the signal that the operational capacity ceiling has been reached — not when the port announces a backlog.
US breakbulk ports are currently avoiding congestion, per the Journal of Commerce, but the caveat is explicit: market uncertainties loom. The container side is already showing the pressure that breakbulk hasn't yet absorbed.
The pattern I wrote about in June's dwell time piece — cargo moving fine until the inland handoff — is now showing up in the intermodal layer specifically. LBCT running overnight shifts to clear a box backlog is a lagging indicator. The leading indicator was drayage capacity tightening three weeks before that backlog formed. Watch the drayage rates. The dwell time follows.


