The Port of Los Angeles just posted its best May in recent memory. 840,165 TEUs processed, up 17% year-over-year, with Executive Director Gene Seroka declaring "no vessel backlogs or cargo delays." On paper, that's a clean bill of health.
Don't read it that way.
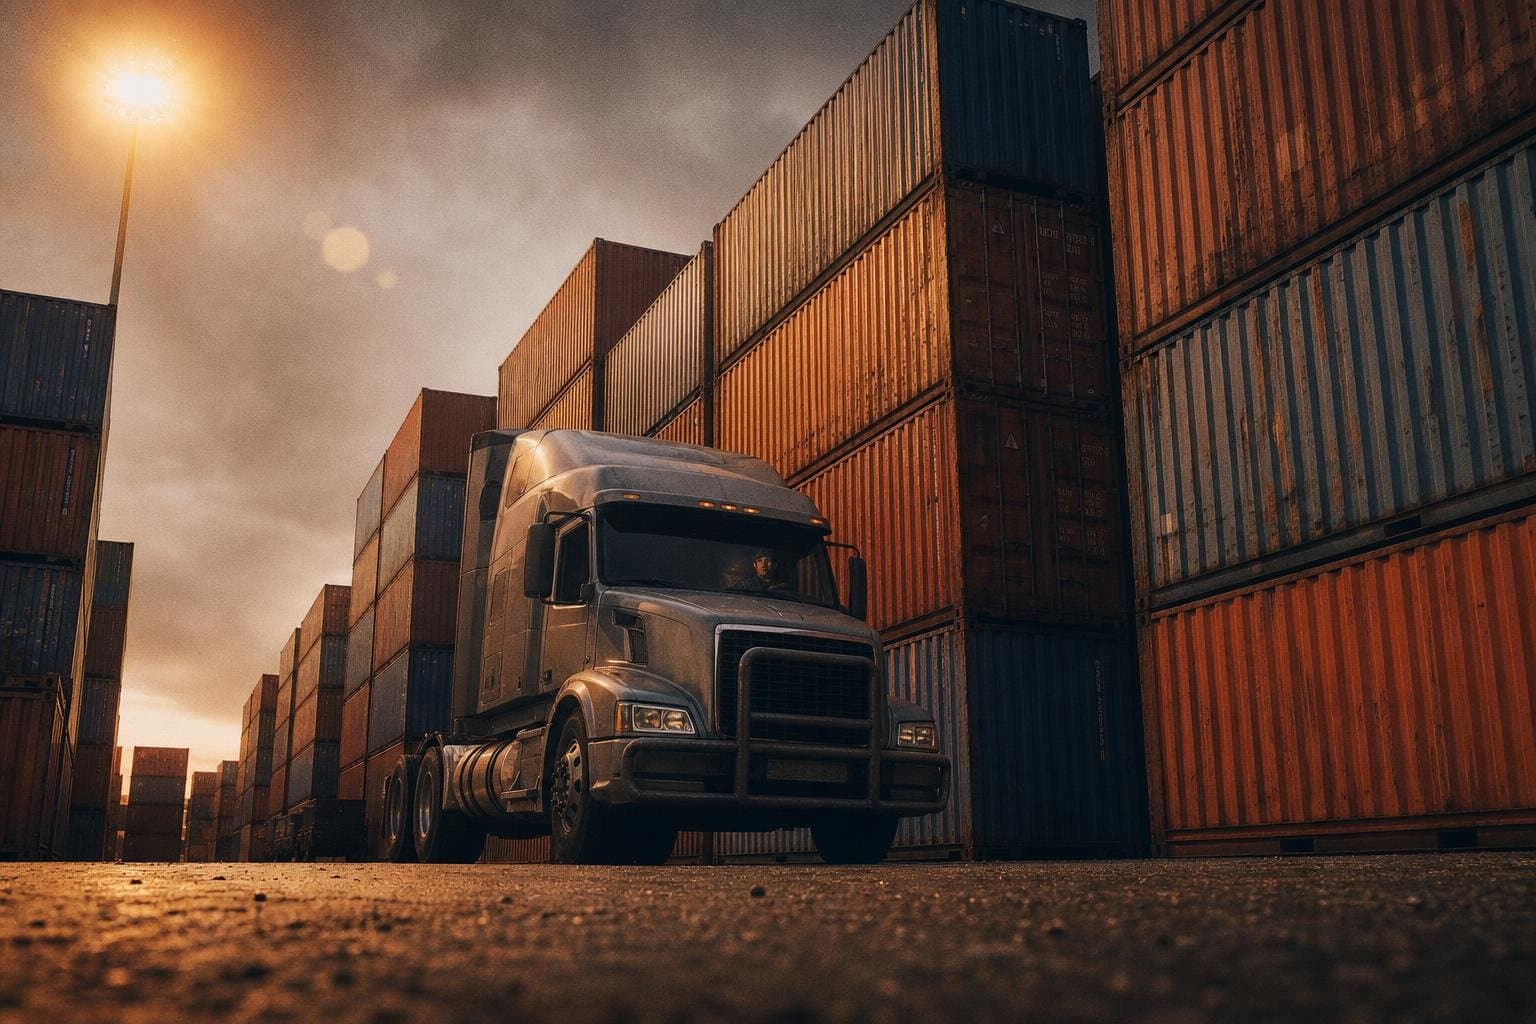
The terminal is one node in a chain. What happens after the box leaves the berth — the drayage appointment, the chassis, the truck, the inland leg — is where the friction is accumulating right now. And the sources of that friction are less visible than a vessel queue, which makes them harder to price, harder to plan around, and easier to miss until they show up as a surprise delay.
The Bottleneck Has Moved Inland
C.H. Robinson's June 2026 drayage market update puts it plainly: "inland execution is creating more friction than terminal congestion itself." Ports are workable. Vessel flow continues. The problem is what happens once the container clears the gate.
The mechanism is worth tracing carefully. Blank sailings, skipped port calls, and discharge-only rotations are compressing cargo arrivals into shorter windows. When a carrier skips a call and pushes volume into the next sailing, you get bunching — a surge of containers arriving at roughly the same time, competing for the same drayage appointments, the same chassis pool, the same truck capacity. The port terminal processes them fine. The pickup window on the other side gets squeezed.
The result, per C.H. Robinson's update, is longer drayage turn times and more variable pickup timing. That's the operational translation of what the assigned topic identifies as a dwell time spike: containers sitting at or near the terminal not because the port is congested, but because the inland coordination layer can't absorb the compressed arrival pattern fast enough.
This distinction matters for procurement. If you're benchmarking against port throughput data — and the Port of LA's May numbers look excellent — you may be measuring the wrong thing. Dwell time is the lie detector, as I wrote back in April. Throughput tells you what moved. Dwell tells you what got stuck and for how long.
Trucking Constraints Are the Multiplier
The trucking shortage isn't new, but its interaction with compressed arrival windows is making it more acute. The 2026 State of Logistics Report identifies labor constraints as one of five structural forces reshaping logistics — not a cyclical dip, but a persistent condition that network design now has to accommodate. Driver shortages, combined with fuel volatility, are already pushing shippers toward rail intermodal where the lane economics work. But rail has its own constraints: C.H. Robinson's update flags railcar shortages in Canada and rail disruption in northern Europe as extending inland dwell and making cross-border timing harder to predict.
The pattern is consistent across geographies. In India's Gujarat gateway region — Mundra, Kandla, Kutch, Gandhidham — reduced trucking availability and labor-related disruption are lengthening container pickup and drop-off timing and increasing the risk of missed vessel cutoffs on the export side. In Oceania, skipped calls are creating the same compressed-arrival dynamic seen elsewhere. The specific causes vary; the structural shape of the problem doesn't.
What's happening is a mismatch between announced capacity and operational capacity — exactly the distinction that matters most for anyone making decisions based on physical constraints rather than carrier press releases. The vessels exist. The terminal slots exist. The drayage network, under compressed arrival conditions with thin driver availability, does not have the surge capacity to match.
What to Watch Through July
A late May diesel price decline in the U.S. offers modest near-term cost relief on fuel surcharges, but C.H. Robinson's update is explicit that this doesn't change operational performance. Appointment availability, chassis access, and inland coordination are carrying more weight than fuel costs right now.
The more important variable heading into Q3 is whether the blank sailing pattern stabilizes. Ocean freight rates on key export lanes have been highly volatile, with carriers aggressively adjusting surcharges and fleet deployment. That rate volatility is a leading indicator of continued schedule instability — which means continued cargo bunching, which means continued pressure on drayage pickup windows.
For procurement teams, the actionable read is this: the port is not your constraint. Your constraint is the 48-hour window after the container clears the gate. Build your planning buffers there, not at the terminal. And watch drayage turn times by region — the Vancouver Fraser Port Authority's supply chain visibility dashboard publishes container truck GPS turn time data weekly, updated Tuesdays, which is about as close to a real-time inland fluidity signal as you're going to get from a public source.
The port numbers look great. That's not where your freight is getting stuck.


