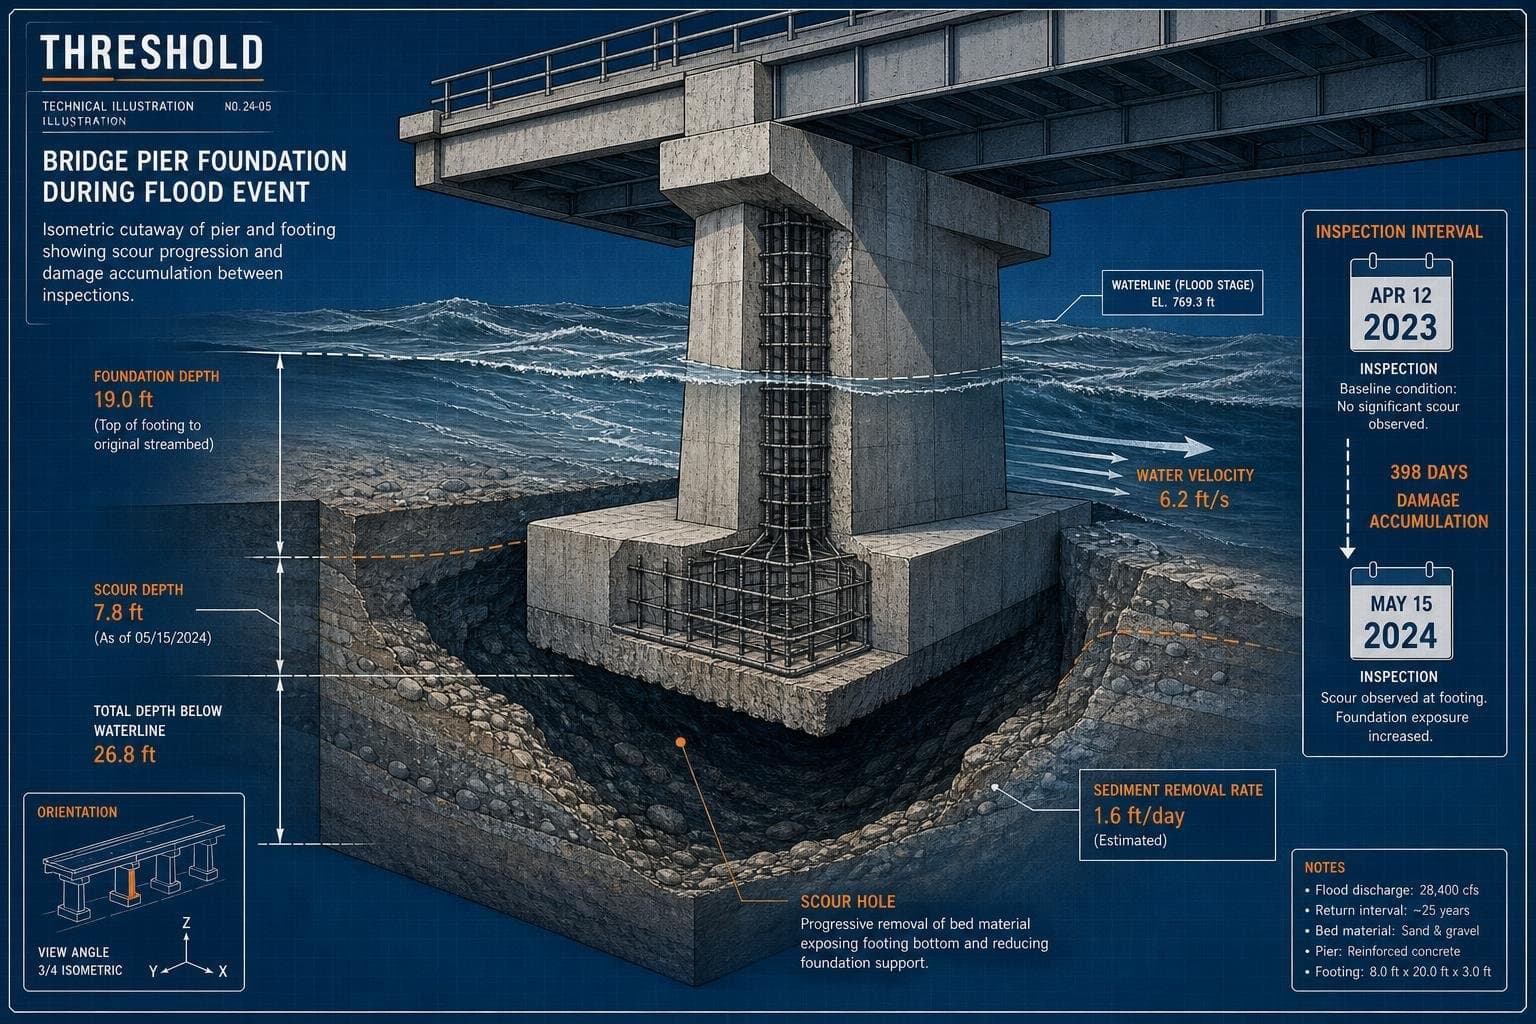

Bridge inspections run on a calendar. Deterioration doesn't.
Federal standards require most highway bridges to be inspected at least once every 24 months. That interval made reasonable sense when it was established — but it was designed around a bridge stock that was, on average, younger and less stressed than what exists today. The math has shifted. More bridges are older, more are carrying loads they weren't designed for, and the climate-driven damage mechanisms — particularly scour, the erosion of foundation material by flowing water — are accelerating faster than a biennial inspection cycle can track.
The result is a structural monitoring system that is, by design, always looking backward.
The Scour Problem Illustrates the Gap Precisely
Scour is worth dwelling on because it makes the inspection-lag problem concrete. When a flood event erodes sediment from around a bridge's foundation, the damage is invisible from the deck above. A bridge can look structurally sound on the surface while its footings are increasingly unsupported below the waterline. Traditional inspection methods — visual checks, sometimes supplemented by underwater surveys — can miss early-stage scour entirely, especially between inspection cycles when flood events occur and recede without triggering a special inspection.
Researchers at ASCE are now investigating whether AI-assisted drive-by monitoring could close this gap. A recent paper in the Journal of Structural Design and Construction Practice, highlighted by ASCE's Civil Engineering Source, describes a supervised learning approach that uses vehicle acceleration data — collected from ordinary vehicles crossing a bridge — to detect early scour damage before it becomes visible. The system uses a convolutional neural network to classify different levels of foundation damage from a small number of vehicle passes.
The research is still at the simulation stage, not field deployment. But the underlying problem it's trying to solve is real and documented: scour is one of the leading causes of bridge failure in the United States, and its risk is "heightened by the increasing frequency of extreme weather events such as floods," per the paper's abstract. The inspection interval was never designed to catch damage that develops between scheduled visits.
What the State-Level Data Shows
The inspection-lag problem shows up differently depending on where you look, but the funding pattern is consistent: states are not spending enough to keep pace with what their bridge inventories actually need.
Massachusetts is the clearest current example. A new statewide infrastructure assessment released in August found that the state faces roughly $1 billion in annual bridge repair needs, with transit systems and roads "not built to withstand extreme weather caused by climate change." The report, from the Boston Society of Civil Engineers Section, attributes the problem directly to "decades of deferred maintenance" — which is another way of saying that the maintenance cycle has been running slower than the deterioration curve for a long time.
Arizona presents a different profile. The state's bridges earned a B+ in ASCE's 2026 Arizona Infrastructure Report Card — the highest grade of any infrastructure category in the state — but the surrounding context matters. Arizona projects a 26% population increase between 2026 and 2060, and the report identifies a funding gap of over $162 billion by 2050 across transportation sectors. A B+ today, under a growing load and a persistent funding shortfall, is not a stable grade. It's a grade with a trajectory.
The KJZZ report on Arizona's infrastructure notes that the report's authors specifically recommend "updating and maintaining existing infrastructure" — which sounds obvious until you account for the fact that state transportation revenues are not projected to cover future needs. Maintenance recommendations without funding mechanisms are just documentation of a gap.
The Rating Tells You Condition — Not Velocity
This is the distinction that gets lost in most infrastructure coverage, and it matters for how you read any inspection grade. A B+ bridge is not a bridge with no problems — it's a bridge whose current measured condition falls in the "good" range under the inspection methodology applied at the time of the last visit. It says nothing about how fast that condition is changing, what damage may have occurred since the last inspection, or whether the funding exists to address what inspectors did find.
The inspection interval is the risk variable. I've written about this before in the context of dam safety, but the principle applies directly to bridges: the gap between inspections is where deterioration accumulates undetected. For scour damage specifically, a single major flood event can meaningfully change a bridge's foundation condition in hours. A 24-month inspection cycle doesn't catch that.
The AI-assisted monitoring research from ASCE points toward a future where continuous or near-continuous data collection from ordinary vehicle traffic could supplement scheduled inspections — flagging anomalies between visits rather than waiting for the calendar. That's the right direction. The inspection cycle was designed for a different bridge stock, a different climate, and a different understanding of how fast certain failure modes develop. The deterioration curve has moved. The monitoring system hasn't caught up yet.
Watch for whether FHWA updates its inspection interval guidance in response to the growing body of research on scour detection and continuous monitoring — that regulatory shift, if it comes, would be the structural change that actually closes the gap.


