
The number that should worry bridge engineers isn't 6.7%. That's the share of U.S. bridges currently rated poor — roughly 41,685 structures as of June 2025, down from 57,049 in 2012. The trend is moving in the right direction, and it gets cited constantly as evidence that the system is working.
The number that actually deserves attention is 49.6%. That's the share rated fair — 309,729 bridges sitting in the middle category, neither failing nor healthy, aging toward the threshold where deferred maintenance stops being an option and becomes an emergency. Between 2015 and 2025, the share of bridges in good condition dropped from 47.3% to 43.7%. The poor-condition share also shrank. The fair category absorbed the difference. That's not progress distributing evenly across the system — it's a structural bulge forming in the middle, and the inspection backlog question is really a question about what happens when those bridges keep aging without adequate assessment cycles.
What "Fair" Actually Means in Load Terms
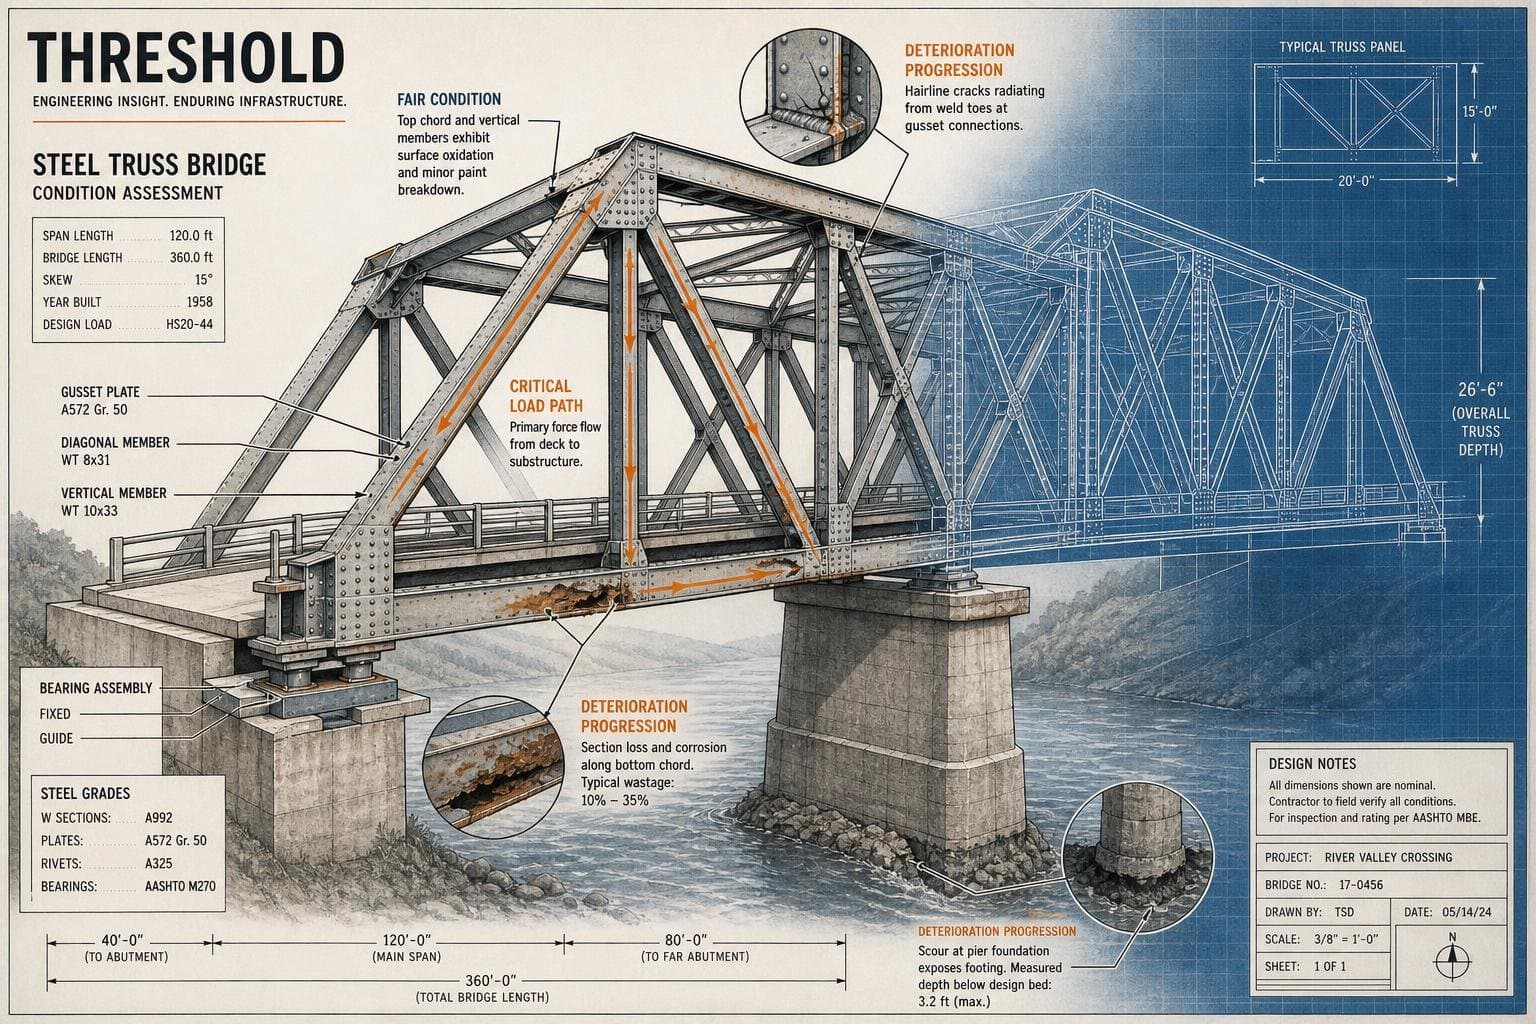
A fair-condition rating under the Federal Highway Administration's National Bridge Inventory methodology doesn't mean a bridge is halfway to collapse. It means one or more structural elements show minor to moderate deterioration — section loss, cracking, scour, bearing degradation — that hasn't yet compromised the primary load path. The bridge remains open and functional. But the margin between fair and poor is where deferred maintenance does its most expensive work.
ASCE's 2025 Report Card makes the cost logic explicit: bridges in fair condition "can be preserved at a lower cost than bridges in poor condition." The window for cheaper intervention is open — but it closes as the structure ages. ASCE puts the average U.S. bridge age at 47 years and projects a $373 billion funding gap for bridges between 2024 and 2033. That gap isn't evenly distributed across condition ratings. It concentrates in the fair-to-poor transition zone, where the cost curve bends sharply upward.
The geographic distribution matters too. About 80% of poor-condition bridges are in rural areas, but 58% of the total deck area in poor condition sits in urban zones — larger structures, higher traffic volumes, more expensive to fix. Iowa, West Virginia, and South Dakota carry the highest percentages of poor-condition bridges at 18.7%, 17.8%, and 16.1% respectively — figures drawn from the Federal Highway Administration's National Bridge Inventory. Those states aren't outliers in inspection capacity — they're outliers in bridge age and rural road density, which means the inspection-to-bridge ratio is structurally worse before any backlog develops.
The Assessment Cycle Is Where Risk Accumulates
Federal regulations require most highway bridges to be inspected at least every 24 months. That interval isn't derived from a universal deterioration model — it's an administrative standard, and the actual risk accumulation between inspections depends on the bridge's age, material, traffic loading, and environmental exposure. A 60-year-old steel truss in a freeze-thaw climate accumulates more structural risk in 24 months than a newer concrete girder bridge in a dry region. The interval treats them identically.
When inspection capacity is constrained — by staffing, budget, or the sheer volume of structures in a state's inventory — the 24-month cycle slips. And when it slips on fair-condition bridges, the window for cost-effective preservation narrows without anyone formally deciding to close it. The backlog doesn't announce itself. It just means the next inspection finds a bridge that has crossed from fair to poor during the gap, and the intervention cost has roughly doubled.
This is the dynamic that AI-based bridge management systems are beginning to address. Researchers at HDR have developed predictive models trained on National Bridge Inventory data to forecast future bridge conditions and prioritize limited rehabilitation dollars — shifting from reactive repair cycles toward proactive intervention. The goal, as HDR's Maryam Bostani describes it, is to let the bridge "tell us what its condition will be in the future" rather than waiting for deterioration to force the decision. That's a meaningful shift in how inspection data gets used, though the models depend on the quality and recency of the underlying NBI data — which loops back to whether inspections are happening on schedule.
The same forensic logic applies when deferred assessment leads to failure rather than timely intervention. When structural distress does occur — as it did during the Pfizer headquarters conversion in Midtown Manhattan in July 2026, where two load-bearing columns buckled on the 21st floor — investigators' first questions center on load history and recent modifications, not just the moment of failure. The principle transfers directly to bridge assessment: understanding what a structure has been carrying, and for how long without review, is foundational to understanding why it fails.
The Reauthorization Moment
Congress is currently working through surface transportation reauthorization. The BUILD America 250 Act, introduced in May 2026 and marked up in the House Transportation and Infrastructure Committee, would provide highway funding through FY2031 including dedicated bridge programs. Among the questions Congress is weighing: funding levels for off-system bridges — those not on designated federal-aid highways — which account for a disproportionate share of rural poor-condition structures.
The reauthorization debate is the right moment to ask whether the inspection interval standard itself needs updating — not just the funding levels. A $373 billion funding gap doesn't close by writing larger checks to the same assessment cycle. The fair-condition bulge is a predictable failure in slow motion. The math says the intervention window is open. The question is whether the inspection frequency is high enough to catch each bridge before that window closes.
Watch for the BUILD America 250 Act's bridge funding provisions as the bill moves through the full House — specifically whether the off-system bridge allocation increases relative to IIJA levels, and whether any inspection frequency reforms are attached.


