Rhode Island's Washington Bridge didn't fail because inspectors missed something obvious. It failed — or rather, forced a crisis — because the deficiencies were inside the structure, accumulating quietly between inspection cycles. Reconstruction costs have already exceeded $427 million, a figure that dwarfs what earlier intervention would have required. That's the deferred maintenance equation in its starkest form: the longer the delay, the more the bill compounds — and the more likely the repair becomes a replacement.
This is the pattern that makes bridge inspection backlogs so dangerous. It's not that inspectors are incompetent or that bridges are secretly crumbling everywhere. It's that the inspection system was designed to catch visible deterioration, and the most expensive failure modes are the ones that develop out of sight.
What Routine Inspections Were Never Built to Find
The standard biennial visual inspection — the backbone of the National Bridge Inspection Program — is good at what it was designed to do: identify surface corrosion, spalling concrete, obvious cracking, and scour damage around foundations. What it cannot do is see inside a structure.
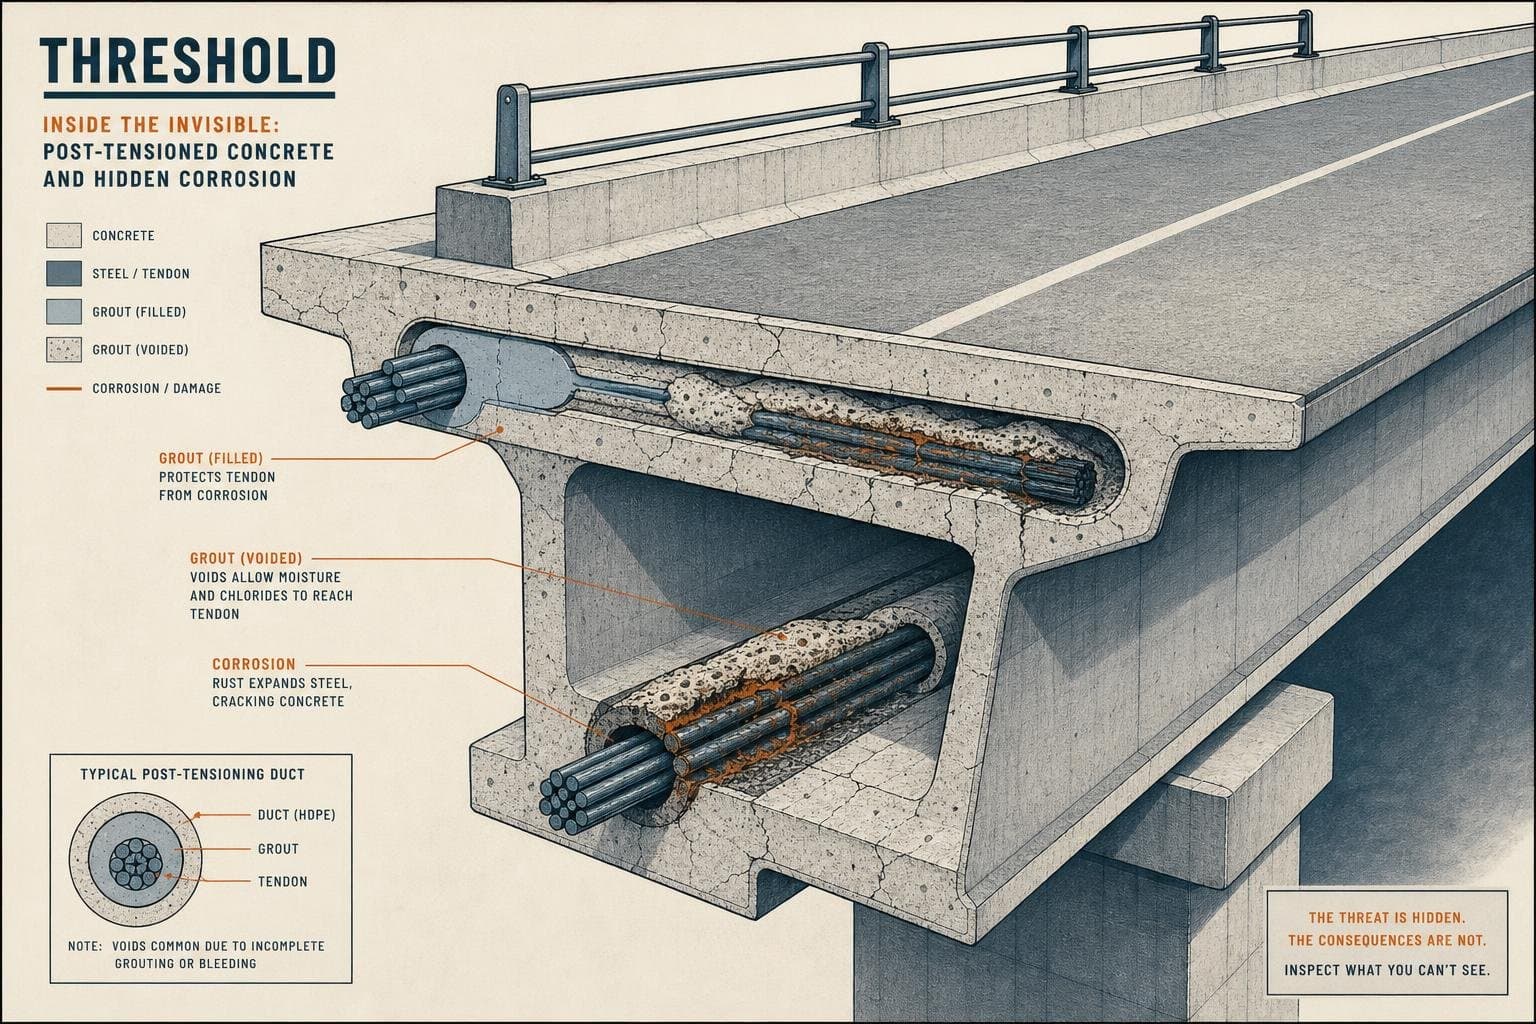
Post-tensioned concrete bridges illustrate this gap precisely. These structures, which have grown steadily in prevalence over the past two decades, contain high-strength steel tendons tensioned after concrete placement. The tendons run through internal ducts, and the greatest concern is deficiencies like water intrusion, voided grout, and corrosion that are often not visually obvious but can significantly reduce load-carrying capacity if left undetected. Many PT bridges in service today were built before the early 2000s, when construction standards differed from current practice — and those older structures often lack the design flexibility to add tendons if capacity is reduced. Once deterioration begins inside them, repair options are typically limited and costly.
A visual inspection of a PT bridge can return a passing grade while the tendons are quietly losing capacity. The inspection interval isn't the only risk variable — the inspection method is too. Last week's issue covered how frequency gaps create blind spots; the hidden-damage problem means that even on-schedule inspections can miss the failure mode that matters most.
41,000 Poor-Condition Bridges, 163 Million Daily Crossings
Scale the hidden-damage problem across the national inventory and the numbers get uncomfortable fast. According to the American Road & Transportation Builders Association, more than 41,000 U.S. bridges were classified in poor condition in 2025, carrying over 163 million vehicle crossings every day. The Federal Highway Administration data cited in the same source puts the average U.S. bridge at approximately 48 years old — well past the 60-to-75-year design life that older structures were built for, and approaching or exceeding it for many.
One in three bridges nationwide requires repair or replacement, per WSB's engineering analysis. That figure isn't a political talking point — it's a condition-based assessment derived from inspection data and sufficiency ratings. Many of those bridges weren't designed for current traffic volumes or vehicle weights, which means the load margin that once provided a safety buffer has been eroded by decades of heavier freight and higher counts.
Heavy truck traffic is the accelerant. Repeated stress cycles fatigue steel connections, bearings, deck joints, and load-bearing members faster than the original design assumptions anticipated. Environmental exposure — corrosion, freeze-thaw cycles, flooding, thermal expansion — compounds the deterioration continuously. The inspection backlog doesn't just mean some bridges go longer between check-ins. It means fatigue damage accumulates in the intervals, invisible to the system that's supposed to catch it.
The Cost Curve Runs One Direction
The Francis Scott Key Bridge replacement is the most visible current example of what deferred attention to infrastructure risk eventually produces — though in that case the cause was a ship collision rather than structural deterioration. Still, the cost trajectory is instructive: Maryland transportation officials are holding to a $5.2 billion replacement estimate, while the contractor's reported ask has reached as high as $9 billion. The initial post-collapse estimate was $1.7 billion. Costs in emergency infrastructure situations don't stabilize — they climb.
The National League of Cities' 2026 Municipal Infrastructure Conditions Survey confirms that municipalities are increasingly relying on local, cash-based funding for infrastructure — a shift away from borrowing that reflects both fiscal caution and limited financing capacity. That's a reasonable response to tight budgets, but it also means capital-intensive bridge rehabilitation competes directly with daily operations for the same pool of money. The projects that get deferred are predictably the ones that haven't failed yet.
The math here isn't complicated. Wireless structural health monitoring — continuous strain, vibration, and tilt tracking — is becoming a larger part of bridge management precisely because it closes the gap between inspection cycles and catches fatigue accumulation before it becomes a crisis. The technology exists. The question is whether the funding and institutional will to deploy it at scale arrives before the next Washington Bridge moment does.
Watch for FHWA's updated bridge condition data later this year, which will show whether the poor-condition count has moved meaningfully since 2025 — and whether the Infrastructure Investment and Jobs Act funding has reached the structures that need it most.


