


The Bedford-Fairhaven Bridge connecting New Bedford and Fairhaven, Massachusetts closed this month, stranding commuters and rerouting commercial traffic across a region that had been watching the structure deteriorate for years. The closure wasn't a surprise to anyone who'd been tracking the inspection record. It was the predictable endpoint of a deferred maintenance curve — the kind that looks manageable right up until it isn't.
That gap between "looks manageable" and "isn't" is exactly what bridge inspection grades are supposed to measure. Most people read a D rating as a warning that something is about to collapse. Engineers read it differently. Understanding that difference is the whole game.
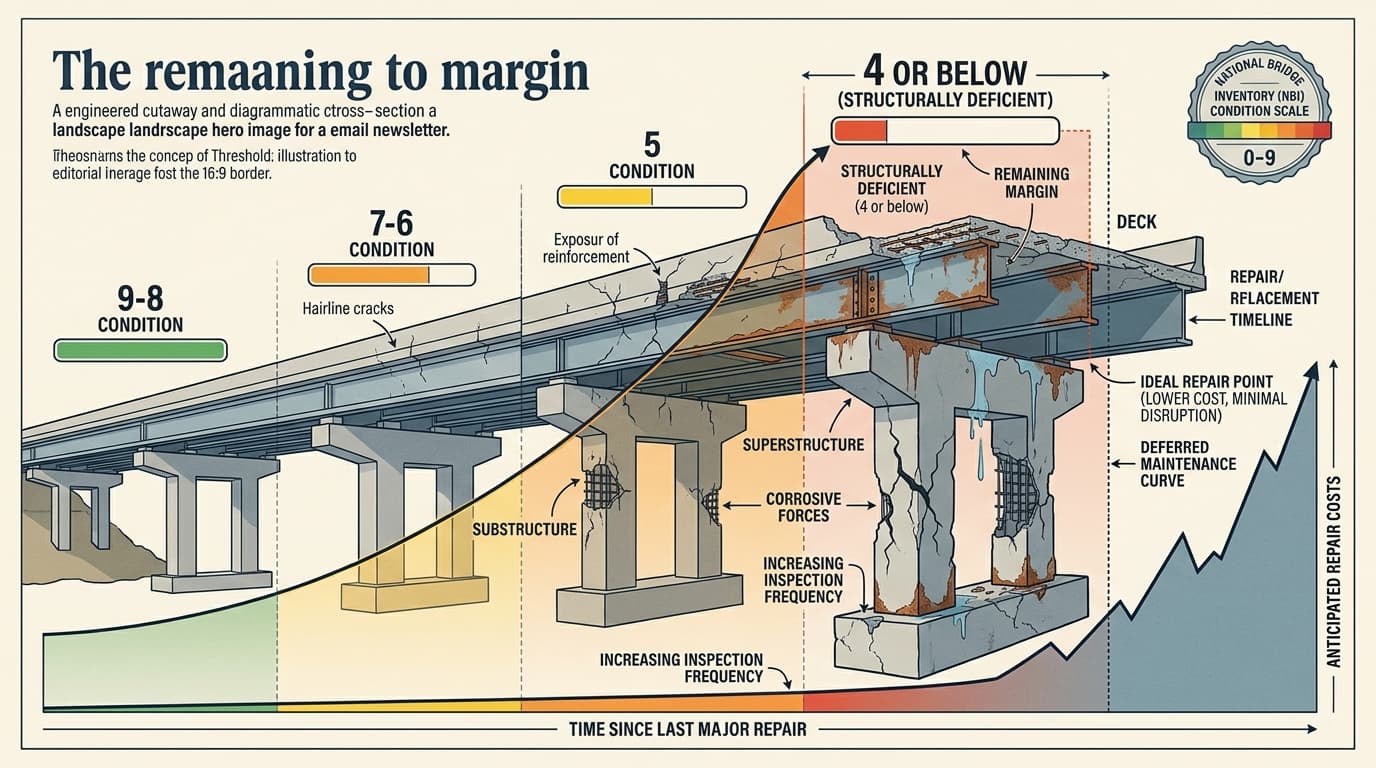
The Rating System Isn't Measuring Imminent Failure — It's Measuring Remaining Margin
Federal law requires uniform inspection of all highway bridges at least every two years, with results logged in the National Bridge Inventory. The NBI uses a 0–9 condition scale for key structural elements — deck, superstructure, substructure — where 9 is new construction and 4 or below triggers "structurally deficient" classification. That classification is what most people translate, incorrectly, as "dangerous."
According to the Reason Foundation's 29th Annual Highway Report, 42,093 of the nation's 618,923 highway bridges — about 6.8% — were rated structurally deficient as of the most recent NBI data. Those bridges carry daily traffic. Most will continue to do so for years.
Structurally deficient means the bridge has elements in poor or worse condition, or that it has load restrictions, or that it requires significant maintenance attention. It does not mean the bridge is unsafe to cross today. A bridge rated 4 on its substructure has measurable deterioration — section loss in steel, spalling in concrete, scour around foundations — but it still has structural reserve. The rating is telling you the margin is shrinking, not that it's gone.
A D on the ASCE report card letter-grade scale (which maps roughly to the NBI's poor-condition range) carries the same logic: it reflects a system that is functioning below acceptable standards and accumulating risk, not one that has already failed. The distinction matters enormously for how you allocate repair dollars and set inspection intervals.
What the Grade Actually Tells a Traffic Engineer
When a bridge drops into poor condition, the practical response isn't closure — it's load restriction and increased monitoring. A structure that once carried unrestricted truck traffic might get posted at 40 tons. Inspection intervals may shorten from 24 months to 12 or even 6. Engineers begin tracking specific defects: the rate of section loss on a corroded girder, the progression of a crack in a concrete pier cap, the depth of scour after each flood event.
The grade is a threshold that triggers a protocol, not a countdown to collapse. That's the engineering-honest read. A bridge can sit in poor condition for a decade under active monitoring and load management without failing. The risk isn't zero — deferred maintenance compounds, and a structure under stress has less reserve to absorb an unexpected load event or a severe weather episode — but the grade alone doesn't set a failure date.
What it does set is a cost trajectory. Maintenance on a poor-condition bridge is expensive and recurring. Rehabilitation — replacing the deck, repairing the superstructure — costs more but resets the clock. Replacement costs the most upfront but eliminates the ongoing liability. The longer a bridge sits in the D range without intervention, the more the rehabilitation option closes off and the replacement option becomes the only viable path.
ASCE's recent work on digitalization and bridge infrastructure points toward sensor-based monitoring as a way to sharpen this calculus — moving from periodic snapshot inspections to continuous condition data that can catch deterioration curves before they steepen. The technology exists. The gap is deployment at scale across a 600,000-bridge inventory.
Bedford-Fairhaven Is the Endpoint, Not the Exception
The Bedford-Fairhaven closure illustrates what happens when a bridge moves through the D range without sufficient intervention and eventually exhausts its options. By the time a structure closes, the cost conversation has already been lost — the community pays in disruption, detour miles, and emergency response rather than in planned rehabilitation dollars spent years earlier.
The inspection grade system is designed to prevent exactly that outcome. A D rating is the system working: it's flagging a structure that still has time on the clock but is burning through margin faster than it's being replenished. The question for every D-rated bridge isn't whether it will fail tomorrow. It's whether the maintenance budget and inspection schedule are matched to the actual rate of deterioration — and whether the rehabilitation window is still open or quietly closing.
Most of the time, the grade is readable. The problem is that reading it requires acting on it.