
Here's a tidy party trick: pick a number, strip it of its time window, strip it of its methodology, and repeat it at enough rallies that it sounds like fact. President Trump has been doing exactly that on inflation, and the gap between what he's saying and what the data actually shows is large enough to be its own case study in denominator abuse.
The 1.8% That Doesn't Match Any Known Number
At a rally in Syracuse on Oct. 9, Trump claimed he "inherited the worst inflation in American history," then said "now we have it down to 1.8%." FactCheck.org checked both halves of that sentence and found both broken.
The "worst inflation in American history" claim ignores the actual record holder: prices rose 23.7% over the 12 months ending in June 1920, in the aftermath of World War I. The inflation Trump inherited peaked at 9.1% in June 2022 and had already fallen to 3.0% by the time he took office in January 2025, per FactCheck.org. That's bad, but it's not a historical record, and conflating "bad under the last administration" with "worst ever" erases a comparison year that actually matters.
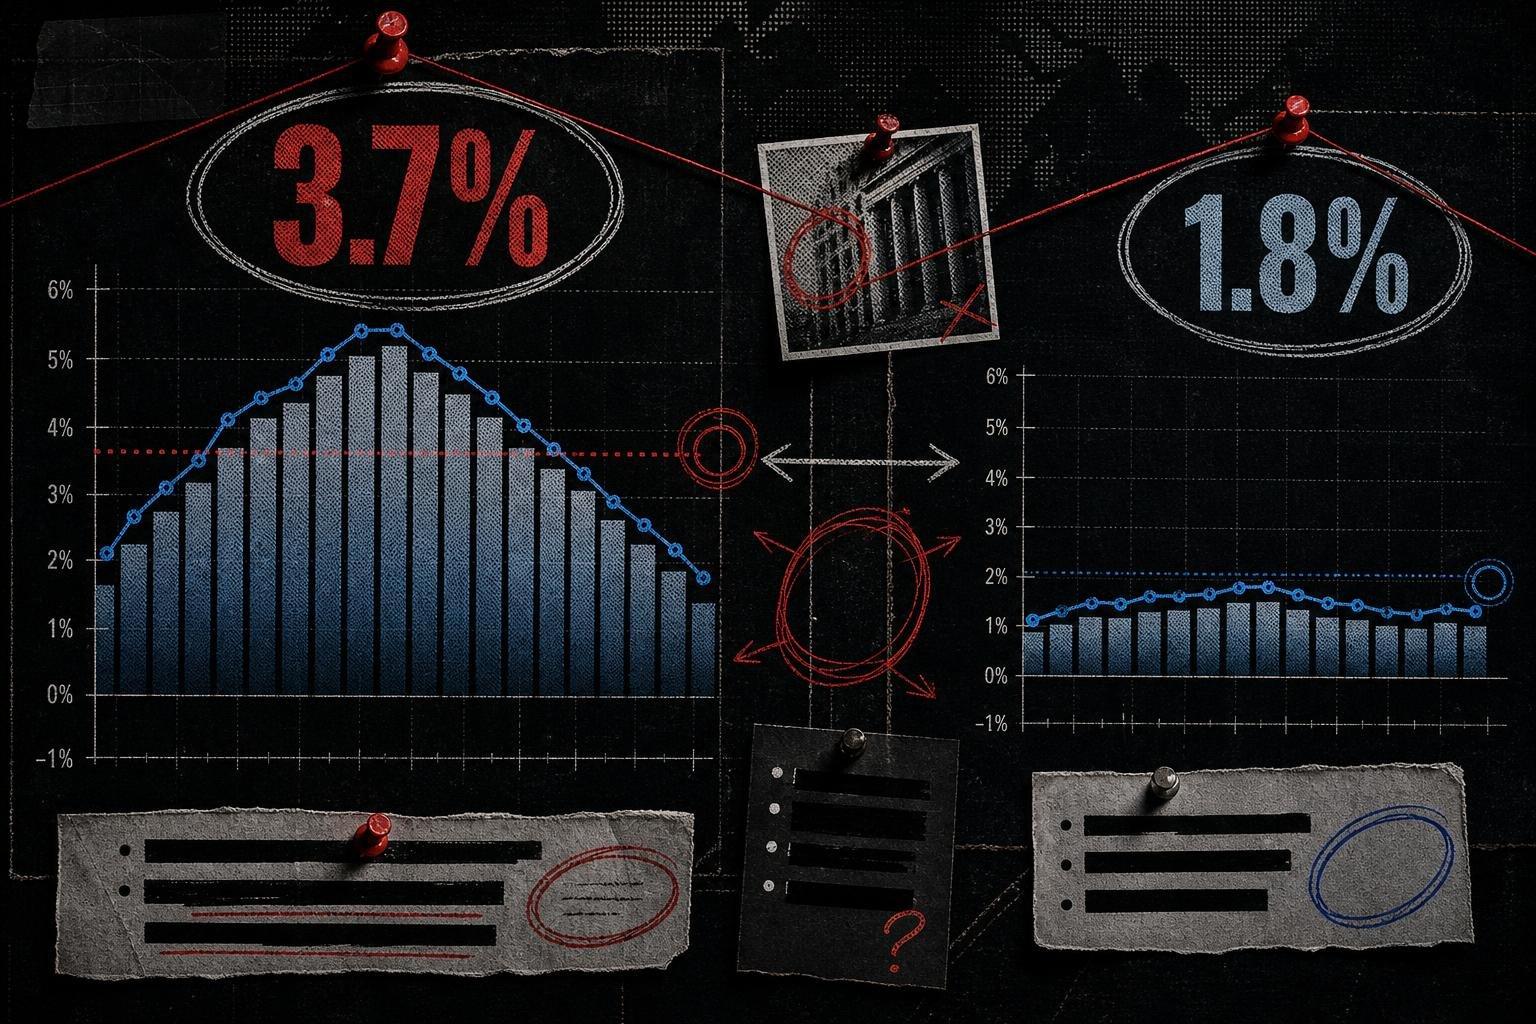
The "1.8%" figure is stranger still, because nobody can locate it in the actual data. Headline inflation — the number most people mean when they say "inflation" — was running at 3.7% for the 12 months ending in September, according to FactCheck.org, which traces the figure back to federal price data. Core inflation, which strips out food and energy, was 2.6% over that same 12-month window — down from the 3.3% rate Trump inherited, but nowhere near 1.8%, and the rate hasn't dipped that low since 2021.
Trump has also used "1.7%" in other appearances, describing it as a three-month figure. That doesn't fix the problem — it compounds it. A three-month price change and a 12-month annual rate are not interchangeable units, and treating them as the same number is exactly the kind of unlabeled time-window swap this newsletter exists to catch. If you don't say whether a percentage covers three months or twelve, the number is meaningless on its own, and nobody should be allowed to just leave that part out.
"Oil Is Tumbling" Is a Claim With an Invisible Baseline
The same speech contained a second, more checkable claim. Talking about the war with Iran, Trump said oil prices were "tumbling down like you've never seen" and "already coming way down." FactCheck.org pulled the actual Energy Information Administration data: West Texas Intermediate crude sat at $98.73 a barrel on Oct. 9, the day of the speech, and had actually risen to $105.25 by Oct. 26. Brent crude, the international benchmark, moved from $130.03 to $128.12 over the same stretch — essentially flat, not falling.
The comparison that makes this claim land wrong is the pre-war price. WTI was $66.96 a barrel on Feb. 27, before the conflict began, per FactCheck.org. Oil isn't "coming way down" — it's sitting well above where it was before the war started, and it ticked up, not down, in the window right after Trump claimed it was falling. This is a case where the direction of the trend and the window you measure it over are doing all the work, and the speaker picked neither correctly.
What a Properly Sourced Number Actually Looks Like
It's worth pausing to note what good statistical disclosure looks like, because the contrast is instructive. The World Health Organization's Global Tuberculosis Report 2026 is the kind of document this newsletter wishes every government press release resembled. It states that domestic TB funding rose 14% between 2024 and 2025, reaching $5.6 billion, and explicitly frames that increase as partially offsetting a decline in international financing of similar scale, per WHO. That's a real time window, a real baseline, and an explicit causal hedge — it doesn't claim the funding increase caused the incidence decline, just that it happened alongside it.
The report goes further than most: global TB incidence fell 14% since 2015, far short of the 50% target, and the regional breakdown is where the real story lives — incidence dropped 42% in Europe and 30% in Africa over that same decade, compared to just 6.6% in the Eastern Mediterranean and 0% change in the Western Pacific, while the Americas actually rose 13% above 2015 levels, according to WHO. Every one of those numbers comes with its comparison year attached. Of the estimated 10.6 million people who developed TB in 2025, 8.4 million were diagnosed — leaving 2.2 million undiagnosed or unreported, a gap the report states plainly rather than papering over, per WHO. This is observational country-reporting data, not a randomized trial, and the WHO treats it that way — it describes association and funding correlation, not proof of causation. More public data should read like this.
The Missing Denominator Problem Isn't Just an American Habit
The same numerator-without-denominator trick showed up this month in Brazil, where social media posts claimed "8 million votes without biometric verification" proved fraud in the country's 2026 election, including votes allegedly cast by dead people, according to a Reuters fact check. The number itself wasn't fabricated — Brazil's electoral tribunal data shows 8,632,488 registered voters who were not authenticated via biometrics still cast ballots in the runoff. What's missing is the context that makes the number mean something.
Voting without biometric confirmation has been part of Brazil's electoral rules since at least 2018 and 2022, per the same Reuters report — if a voter's fingerprint fails to register four times, a poll worker can verify identity by birth year instead. More than 17 million registered voters hadn't even had fingerprints collected as of 2026. An independent analysis of voting-machine logs found about 15.9 million people voted without biometric verification in the runoff overall, and of the ballots cast after the extended 7 p.m. deadline, only 5,446 lacked biometric confirmation — the rest had already been authenticated. There's no official data tying any of this to deceased voters. The 8 million figure is real. The fraud conclusion built on top of it is not supported by anything in the underlying records.
A second Reuters fact check from the same week caught a different version of the same failure mode — this one temporal rather than numerical. A news segment about Brazilian retirees being billed for improperly disbursed benefits was recirculating on social media as if it described a current policy under the Lula administration. The segment actually aired in October 2016, under a different president entirely. No time window, no comparison year, no accurate claim. The clip was old news wearing a new hat.
What to Watch Before the Next Round of Claims Circulates
The throughline across all four of these cases is the same: a real number, stripped of the window and the baseline that would let you judge it, repurposed to support a conclusion the underlying data doesn't actually reach. None of these are fabrications. They're worse, in a way, because they're built from genuine figures that just happen to be the wrong genuine figures for the claim being made.
Two things worth tracking before this recurs. The next monthly CPI release will settle whether the 3.7% headline rate holds or moves, and any rally claim about "where inflation stands now" should be checked against whichever 12-month window the release actually covers. And watch for how the WHO's TB funding numbers get cited elsewhere in the coming months — a 14% domestic-funding increase is exactly the kind of figure that gets quoted without its 2024-to-2025 window attached once it leaves the original report. The number survives. The context rarely does.


