


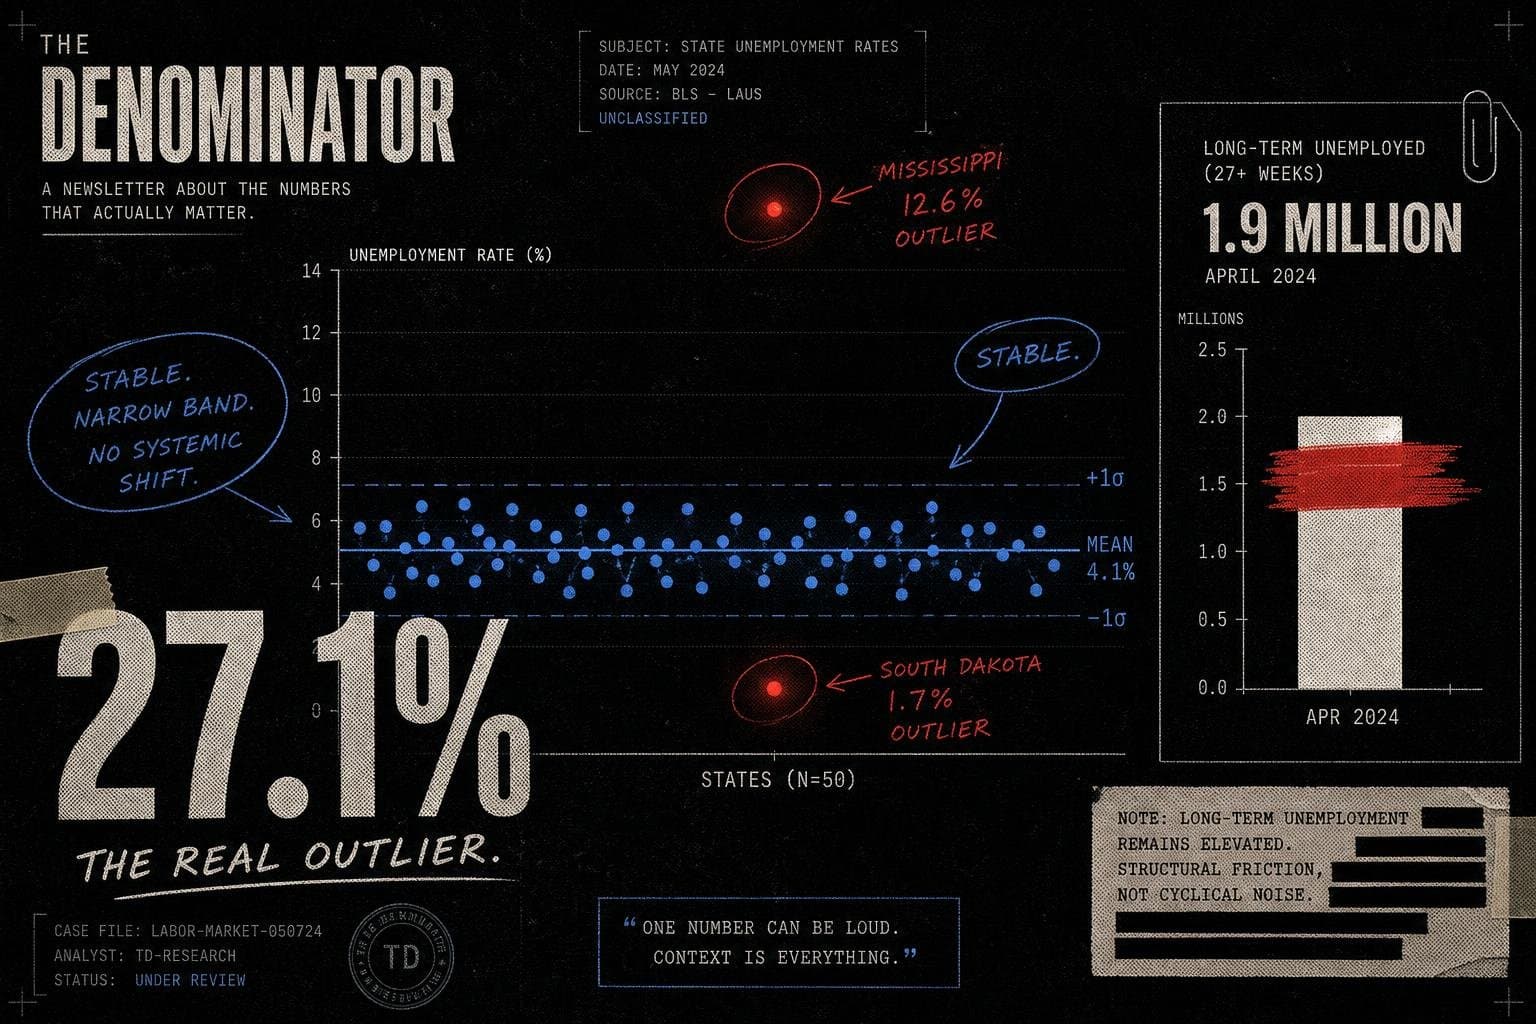

National payrolls rose by 29,000 in September 2026, and the unemployment rate held at 4.2 percent, according to the Bureau of Labor Statistics. That's the headline. Scroll down to the agency's state-level release from October 20, and the pattern repeats at a scale that should make you pause: unemployment rates were lower in 5 states, and "stable" in 45 states plus the District of Columbia. Nonfarm payroll employment increased in 2 states, decreased in 1, and was "essentially unchanged" in the other 47 jurisdictions, per the BLS state employment release.
Forty-seven states unchanged. Two states up. One state down. Add it together and you get a national gain of 29,000 jobs — spread across an economy with roughly 160 million people in the labor force. That's not stability in the sense of "things are fine." It's stability in the sense of "the needle barely moved, and the agency's own confidence intervals can't tell you whether most of these state figures moved at all."
The word "stable" is a measurement limit, not an economic verdict.
This is a general problem with survey-based economic data, not a BLS-specific quirk. The Census Bureau's Business Trends and Outlook Survey, which draws on roughly 1.2 million businesses split into panels reporting every twelve weeks, exists precisely because point-in-time snapshots need continuous, overlapping measurement to separate real movement from sampling noise, according to the Census Bureau's October release. When an agency says a figure is "not appreciably different," that's a statement about whether the change clears the noise floor built into the survey design — not a claim that nothing happened on the ground.
Compare the year-over-year picture to the one-month snapshot: 20 states and DC had unemployment rate decreases over the twelve months ending September 2026, 7 states had increases, and 23 had little change, also per the BLS release. That's a wider, noisier spread than the single-month comparison suggests, and it's the window worth watching if you actually want to know whether state labor markets are diverging. The instinct to demand longer time windows and disaggregated subgroups before declaring a trend isn't unique to labor statistics — it's the same logic behind efforts like the WHO's forthcoming inequality reporting on noncommunicable diseases, which exists because national averages routinely hide which subgroups are actually moving and which aren't.
The other number buried in the national release deserves its own line: 1.9 million people have been jobless for 27 weeks or more, accounting for 27.1 percent of all 7.1 million unemployed people in September, BLS reports. More than a quarter of unemployed Americans aren't cycling through short job searches. They're stuck. That's a composition story, not a headline-rate story, and it's the kind of detail that "4.2 percent, unchanged" is built to hide.
None of this means the labor market is secretly collapsing. It means a report full of "little changed" language is doing exactly what it's designed to do: discouraging you from treating single-month noise as a trend. The discipline is boring. It's also correct.