
Here's a sentence that should make you nervous every time you read it in a news story: "Only 1 in 6." It sounds damning. It's also meaningless unless you know what the 6 is made of.
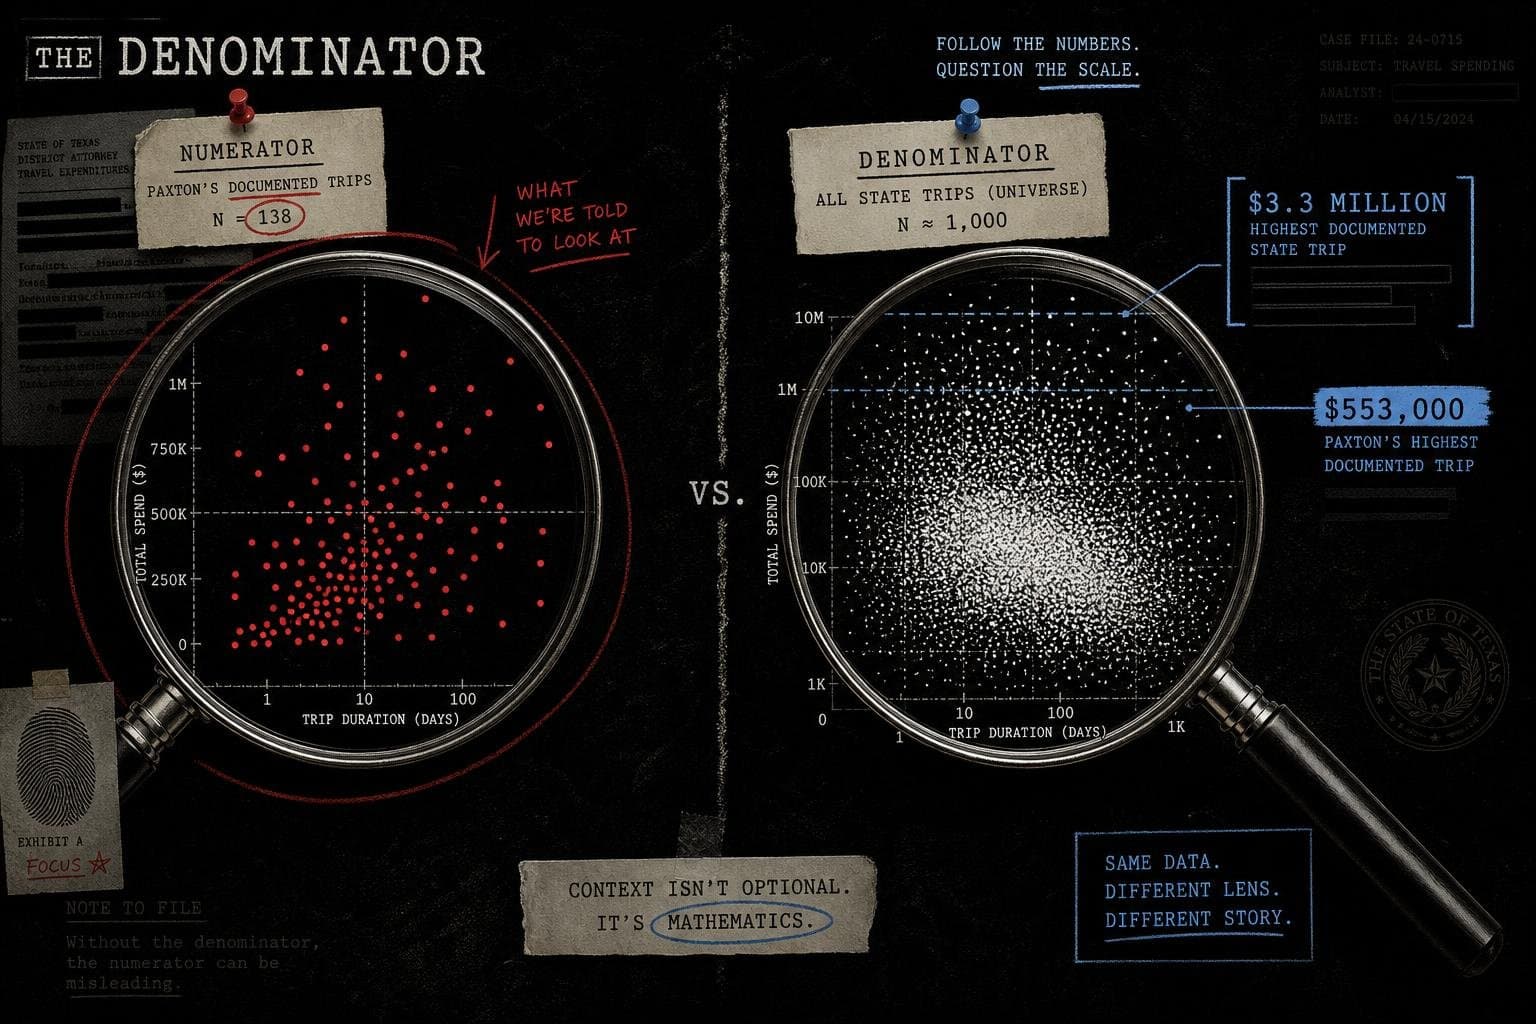
In ProPublica and the Texas Tribune's investigation into Texas Attorney General Ken Paxton's travel security, the 6 is made of something specific: nearly 1,000 trips taken during his tenure, of which the reporters could connect 138 trips — and $553,000 in security costs — to a stated state business purpose, out of $3.3 million spent on security overall. That's roughly one trip in seven having documented purpose, and roughly one dollar in six of security spending tied to work the reporters could verify. The ratios aren't identical, but they're close enough to tell a consistent story, and that consistency is exactly what makes this investigation worth studying as a model — not just for what it found, but for how it built the thing it found.
The Fraction Only Means Something Because Both Numbers Exist
Most viral statistics fail at the numerator. Someone counts something — complaints, incidents, dollars — and reports the count as if it speaks for itself. The Paxton story is unusual because the reporters did the harder work twice: they built a numerator (trips and dollars with a stated business purpose) and a denominator (total trips and total security spending), from the same underlying records. Paxton's office didn't hand them a conclusion. According to the piece, the reporters "review[ed] every publicly available document Paxton's office says it possesses about his travel" to construct both sides of the ratio themselves.
That matters because a one-sided version of this story already existed. The Associated Press had reported, as ProPublica notes, that Paxton traveled frequently out of state while listing little on his official calendar — a numerator without a clean denominator. What ProPublica and the Tribune added wasn't a bigger number. It was the other half of the fraction: the full universe of roughly 1,000 trips and $3.3 million in costs against which the 138 documented trips and $553,000 could be measured. A number without its base rate is an anecdote wearing a statistic's clothes. This is the difference between the two.
I'd flag one thing the investigation is careful about and that's worth naming explicitly: an undocumented business purpose is not the same as a confirmed personal trip. The reporters report what they could connect to state business, not what they've proven was not state business. That's a real distinction, and the piece holds it — it describes incidents like the 2023 trips to Park City and Vail during Paxton's suspension as trips with no official calendar entries, not as trips proven improper by some independent test. Correlation between "no documented purpose" and "personal travel" is strongly suggestive here, given the timing and destinations. It is not proof of intent, and good reporting says so by sticking to what the records show rather than what they imply.
A Case Count Is Not a Rate, and ProPublica's Other Big Story This Month Shows the Difference
Compare that to ProPublica's separate investigation into U.S. citizens detained during immigration enforcement, published days earlier. The reporters tallied more than 500 documented cases of citizens held by immigration agents — including more than 100 Americans questioned about their citizenship, at least 70 children and teens, and at least 63 people detained while recording. These are real, individually verified cases, cataloged one by one.
But notice what's structurally different from the Paxton story: there's no denominator here, and the reporting doesn't pretend there is one. We don't know the total number of stops, encounters, or detentions attempted during this period, so there's no way to compute a rate — no "X% of detentions involved a citizen." The story's claim is explicitly a count ("more than 500 cases... at a far larger scale than previously reported"), not a rate, and that's the honest way to present it. The danger is what happens next: when a count like 500 circulates on social media, it tends to get converted into an implied rate by the reader's own brain, stripped of the caveat that nobody — including the people compiling the tally — knows what it's a fraction of. The investigation did the hard part by building a floor. It would be a mistake for anyone downstream to treat that floor as a percentage.
The Boring Government Survey That Actually Shows Its Work
While those two investigations were making headlines, the Census Bureau quietly released a new round of data products from its Business Trends and Outlook Survey on October 8. Nobody's going to write a viral thread about it, and that's part of why it deserves a mention here: it's a methodology that discloses itself completely. The sample is roughly 1.2 million businesses, split into six panels of about 200,000 cases each, with each panel reporting every 12 weeks for a year. The bureau even tells you the survey takes about nine minutes to complete. You can look up exactly what population it represents — all employer businesses excluding farms — and exactly how often it refreshes.
Compare that transparency to the kind of "business confidence surveys" that get cited in opinion pieces without a sample size attached. When I see a percentage from a business survey with no stated N, I can't tell you if it's representative of 1.2 million firms or 40 people who answered an email blast. The BTOS release is a reminder that the unglamorous, fully-documented dataset is usually more trustworthy than the dramatic, half-sourced one — even if it never trends.
Even Global Health Data Needs Its Time Window Stated Out Loud
The WHO's new Global Health Estimates, also released this month, offer a useful case of a trend claim done correctly. The report states that noncommunicable diseases accounted for 74% of global deaths in 2023, compared with 58% in 2000 — a comparison that names both the end point and the start point, which is the whole ballgame when someone tells you something is "up." It also reports that global deaths from dementia tripled over that same 2000-to-2023 window, with dementia moving from the 19th leading cause of death globally to the fifth.
That tripling is a real, sourced figure, and it's tempting to read it as evidence that something is making people's brains deteriorate faster than before. The WHO data doesn't support that reading, and to its credit, the release doesn't make that claim. Global life expectancy itself has risen over the same period — reaching 73.3 years in 2023, nearly back to the 73.4 years recorded in 2019 after a pandemic dip — which means more people are living long enough to develop diseases that mostly strike in old age. A population living longer will naturally see more dementia deaths in absolute and even proportional terms. That's a demographic mechanism, not evidence of some new causal insult. The WHO data shows an association between calendar year and dementia mortality; it says nothing about cause, and neither should anyone citing it.
Sample Sizes Belong in Finance Coverage Too
One more worth flagging, if only because it shows the discipline working outside the usual government-data context. A recent Reuters commentary on Fed messaging cites a Bank of America survey of roughly 170 global fund managers, collectively steering about half a trillion dollars, taken September 4–10, in which 52% expected no Fed rate move before the November elections — down from 75% in the prior month's survey. That's a small, named sample with a clear collection window and a clear prior-month comparison baseline. It's not a knock on the piece that the sample is modest; it's a credit that the sample size is stated at all. Readers can judge for themselves how much weight 170 fund managers should carry. Most market surveys that get quoted in headlines don't give you that option.
The Habit Worth Stealing
None of these stories are related by subject. A state attorney general's travel budget, immigration enforcement, business confidence, global mortality, and Fed-watching fund managers have nothing to do with each other on the surface. What connects them is a discipline: state the denominator, state the time window, name the sample, and say plainly when a number is a count rather than a rate. The Paxton investigation did the expensive version of that discipline — building the denominator by hand from public records because nobody was going to hand it over. The next time a percentage crosses your feed without a base rate attached, ask what it would take to build the other half of that fraction, and notice how rarely anyone has bothered.


