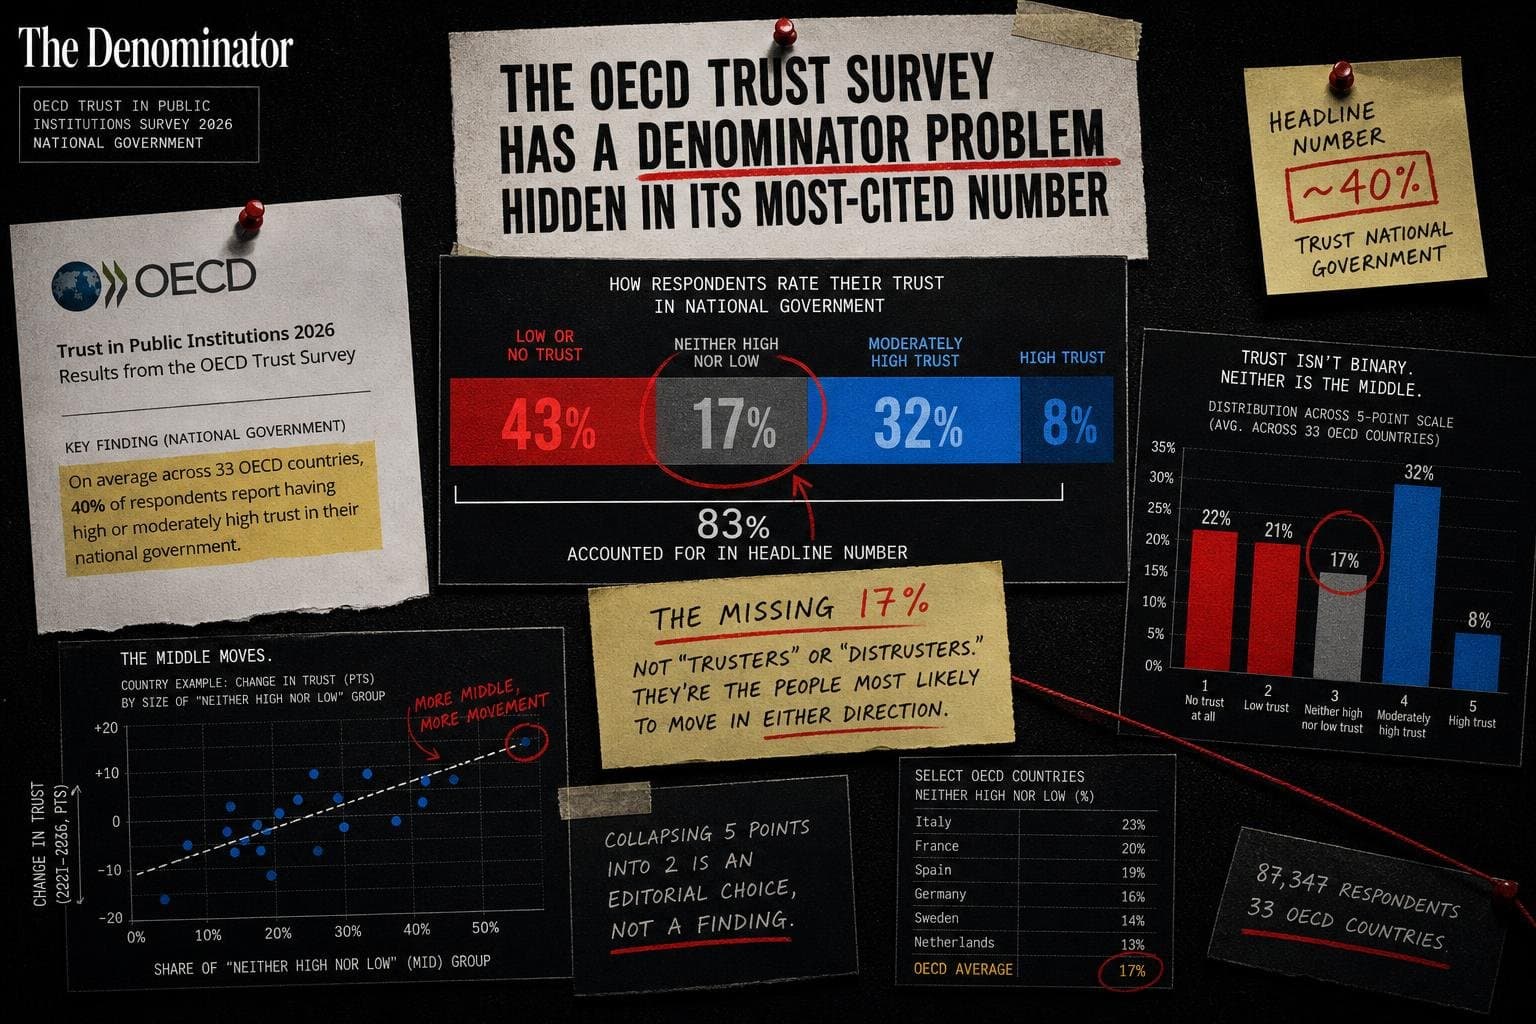

A number is circulating from the OECD's 2026 Trust in Public Institutions survey: roughly 40% of people across 33 OECD countries trust their national government. That's the headline. It's also the least interesting thing in the report — and the way it's being used skips the denominators that actually matter.
Here's what the survey actually found, and where the framing breaks down.
1. "40% Trust" and "43% Don't Trust" Add Up to 83%. What's the Other 17%?
The OECD report states that 40% of respondents have "high or moderately high" trust in national government, while 43% have "low or no trust." That's 83% accounted for. The remaining share — somewhere around 17% — sits in an ambiguous middle category that the headline number erases entirely.
When you collapse a five-point scale into a binary, you're making an editorial choice, not reporting a finding. The 17% in the middle aren't "trusters" or "distrusters." They're the people most likely to move in either direction based on policy performance. Treating them as statistical rounding error is how you turn a nuanced dataset into a talking point.
2. The "Stabilized" Trend Claim Needs a Time Window
The report says trust levels have "stabilised at around 40%." Stabilised since when? The survey compares 2025 data to 2023 and 2021 waves — a four-year window across three data points. That's not a trend. That's three snapshots.
The OECD also notes that trust "substantially improved in about half of the countries where it had previously declined." Half of the countries that declined. Not half of all 33 countries. The denominator keeps shrinking as the sentence progresses — a classic construction that sounds more positive than the underlying data warrants. It's the same compression problem this publication flagged in the BLS's May employment release, where aggregate stability masked meaningful subgroup divergence.
3. The AI Confidence Number Is Being Cited Backwards
Here's where it gets genuinely interesting. The survey finds that "only around four in ten people are confident that government use of AI could lead to more tailored public services." That's the skeptical framing — and it's accurate. But the report's own summary block leads with the same figure as a positive: a meaningful share of respondents are confident in government AI use.
Same number. Two opposite editorial framings. Neither is wrong. Both are incomplete without the breakdown by AI familiarity, which the OECD notes exists — respondents familiar with AI express higher confidence — but doesn't fully quantify in the public summary. The subgroup effect is doing real work here, and it's buried. This is structurally identical to how the Census Bureau's AI adoption survey produced aggregate figures that obscured significant regional variation in the underlying data.
4. The Voting Gap Is the Number Worth Watching
This one is clean and striking. 68% of respondents believe voting affects government decisions. Only 31% feel the political system gives people like them a meaningful say. That's a 37-percentage-point gap between believing the mechanism works in theory and feeling it works for you specifically.
That gap is the actual story. It doesn't require any denominator adjustment. It's a direct measure of perceived political efficacy versus formal participation — and it's the kind of number that predicts disengagement, not just dissatisfaction. ProPublica's ongoing accountability work has documented how exactly this kind of efficacy gap — between what institutions claim to do and what affected populations experience — drives long-term erosion of public confidence in expert bodies.
What to Watch For When This Survey Gets Cited
- "Trust is at 40%" — ask: 40% of what response scale? What's in the middle category?
- "Trust has stabilized" — ask: over what time window, and in how many of the 33 countries?
- "Half the countries improved" — ask: half of which subset? Countries that previously declined, not all surveyed countries.
- Country variation — the OECD covers 33 countries with significant variance. An aggregate number across Finland and Hungary is not a finding about either country.
The survey itself is methodologically serious — 33 countries, comparable methodology across waves, explicit breakdowns by demographic group. The problem isn't the data. It's the summary layer, where the interesting variance gets compressed into a single percentage that travels well on social media and tells you almost nothing about why trust is where it is.
The 37-point voting-efficacy gap doesn't compress as neatly.


