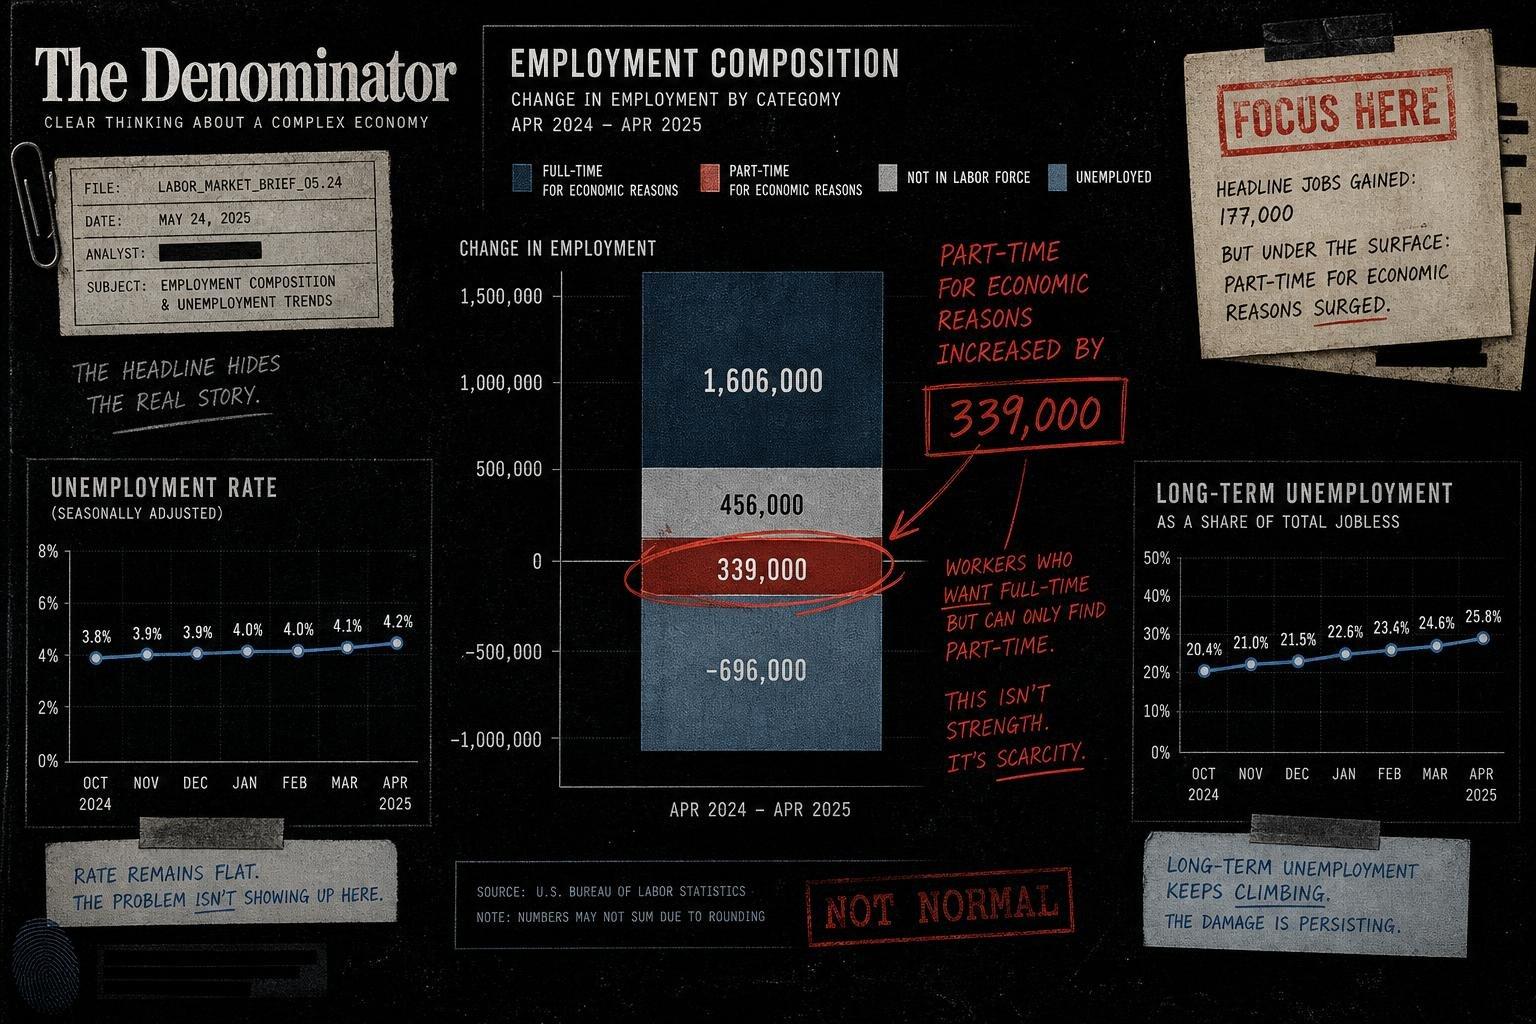

Here's the sentence that will show up in every wire story this week: nonfarm payrolls rose by 165,000 in October, and the unemployment rate was "little changed" at 4.1 percent, per the Bureau of Labor Statistics. That's the headline. It's also the least interesting row in the release.
I've spent three months on this newsletter watching the unemployment rate hold still while the numbers underneath it moved. This month's release follows the same pattern, with a new wrinkle worth isolating: the part-time-for-economic-reasons count.
The Headline Rate Hasn't Moved. That's the Point, Not the Reassurance.
The unemployment rate has sat in a narrow 4.1-to-4.3 percent band since March, according to the BLS release — seven months of near-stasis. The number of unemployed people, 7.1 million, is likewise described as "changed little." When a statistic is this stable for this long, the stability itself becomes the story, because it means whatever is happening in the labor market is happening below the headline, not in it.
This isn't unique to labor data. Government statistics agencies produce this shape of story constantly: a topline figure holds steady while a structural shift builds quietly in the rows underneath. The Census Bureau's own long-range population projections work the same way — a country's total population can look flat for years while fertility and migration trends underneath are already pointing toward decline decades out, as the Bureau's latest territorial projections illustrate for places like Guam, where the headline number won't turn negative until 2030 even though the underlying drivers are already in motion. Stable aggregates hide moving parts. That's not a coincidence of methodology — it's what aggregation is for.
Two rows below the jobs headline, long-term unemployment — people jobless 27 weeks or more — sits at 2.0 million and now accounts for 27.6 percent of all unemployed people, per the same BLS release. Base rate matters here: that's 27.6 percent of 7.1 million unemployed, not 27.6 percent of the labor force, and not a new record. But it's the kind of share that tends to climb quietly while the topline rate holds, because someone can cycle out of the official unemployed count — by stopping the active job search BLS requires — without ever finding work. The denominator shrinks before the economy improves.
The Real Mover This Month Is People Who Wanted Full-Time Jobs and Couldn't Get Them
The number that actually moved in October: people employed part time for economic reasons jumped by 339,000 to 4.8 million, according to BLS. These are workers whose hours got cut or who couldn't find full-time work despite wanting it — not people choosing part-time schedules. A one-month jump of this size, in a single monthly household survey, is the kind of figure that deserves a "compared to what" before anyone builds a trend line out of it. One month of data from the Current Population Survey — a monthly sample of roughly 60,000 households — isn't a trend; it's a data point. BLS itself flags the broader measures as "little changed" month over month, and a single-month swing in a subsample-derived statistic can reflect survey noise as easily as a real shift in underemployment.
It's worth remembering how often a reported figure turns out calmer, or messier, than the pre-release anxiety suggested. Ahead of this week's midterms, election experts had braced for widespread disruption at the polls; ProPublica's reporting found that the feared chaos had largely not materialized, even as specific, real problems persisted underneath the calm topline. The lesson transfers: a headline that reads as stable doesn't mean nothing happened, and a headline that reads as alarming doesn't mean the underlying reality is uniform. You have to check the rows.
Labor force participation (61.9 percent) and the employment-population ratio (59.3 percent) are both described as showing "little net change since January," per BLS — a ten-month window, not a one-month snapshot, which is the correct way to read a participation rate. A single month's participation number without that window is close to meaningless; participation moves on retirements, school enrollment, and disability claims that don't resolve in 30 days.
None of This Says Why. It Only Says What.
It's tempting to attach a cause here — tariffs, rate policy, AI-driven hiring freezes, take your pick — but the household and establishment surveys that produce these numbers are observational measurements of the labor market, not experiments that isolate a driver. The CPS and the separate establishment survey (a different sample, of roughly 119,000 businesses and government agencies, per BLS's own methodology notes) tell you what happened to employment and hours. They don't tell you why, and reporting that treats "165,000 jobs added" as proof the labor market is "healthy" is doing causal work the data doesn't support.
A good discipline for reading any percentage without a cause attached: always ask what the base is before accepting the framing. The World Health Organization's own fact sheet on physical activity is a clean example of doing this right — it reports that 31 percent of adults and 86 percent of adolescents don't meet recommended activity levels, stating both figures with their distinct denominators rather than blending two different populations into one scary number. Labor statistics deserve the same discipline. Correlation between a soft payroll number and any particular policy explanation is a claim for a different kind of study — ideally one with a control group, which a monthly government survey is not.
What to actually watch: whether the 4.8 million part-time-for-economic-reasons figure holds or reverses in the November jobs report, due in early December, and whether the long-term unemployed share keeps climbing past 27.6 percent. One of those is noise until it repeats. The other has already repeated for three straight releases.


