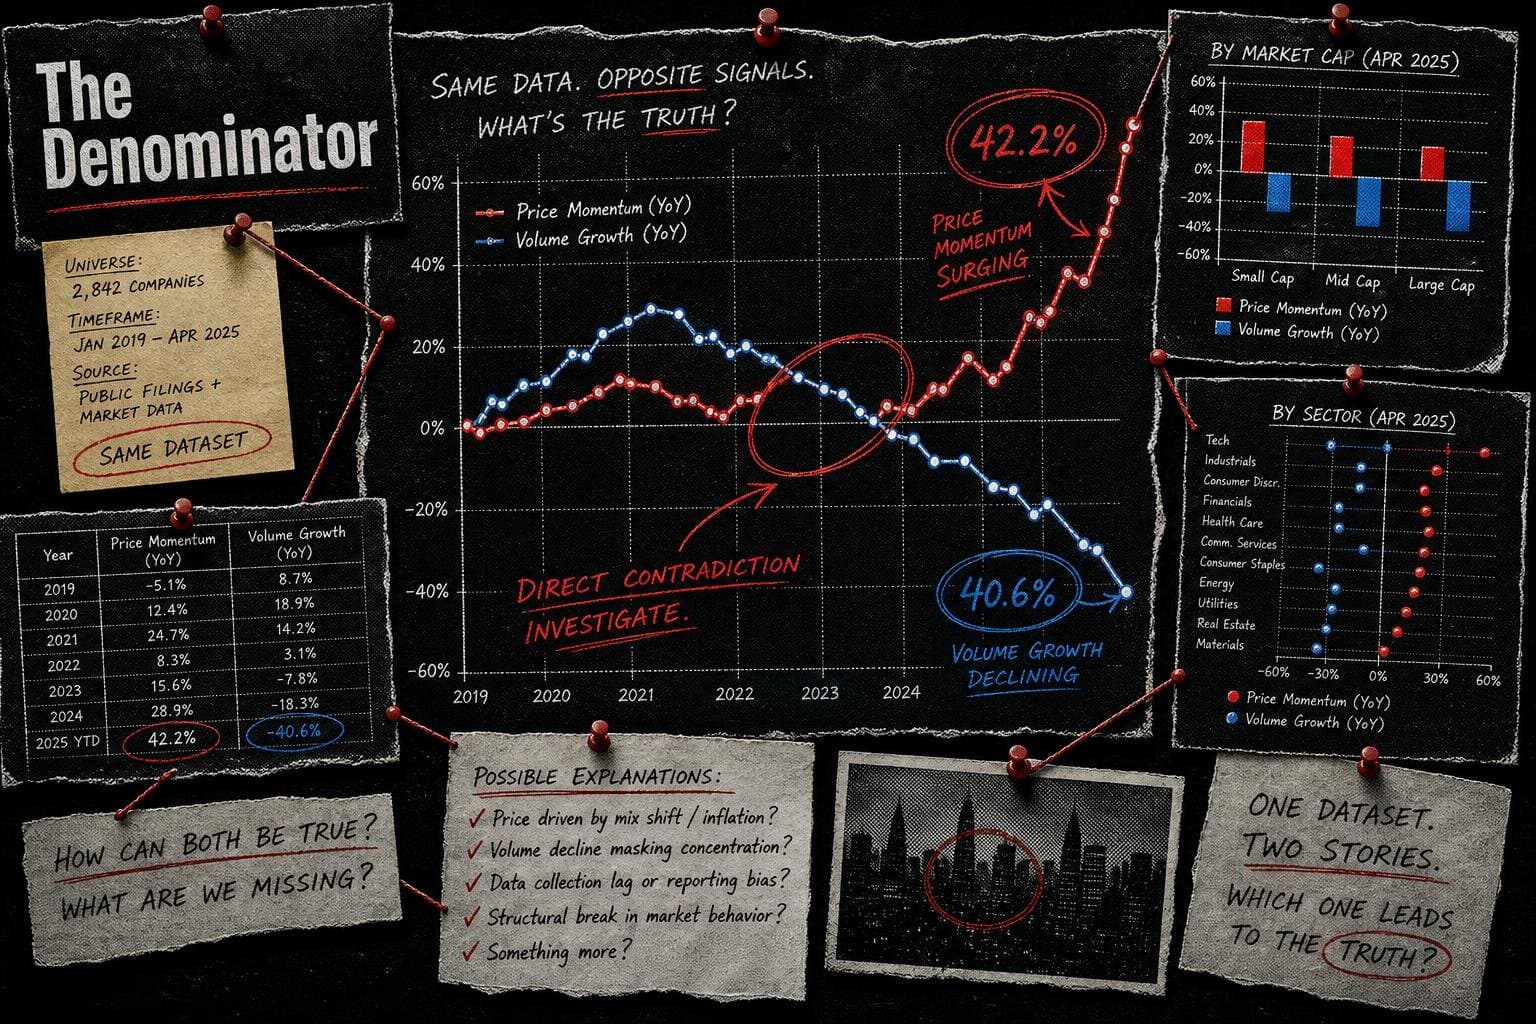

I covered this exact tension back on July 8 and again on July 29. The numbers haven't changed — but the August 4 release is tomorrow, and the framing problem is worth revisiting before a new round of headlines lands.
Here's the trick that keeps working: report the monthly number, skip the year-to-date number, and the story inverts.
The Monthly Number Is Real. It's Also the Wrong Denominator.
The Census Bureau and Bureau of Economic Analysis reported on July 7 that the U.S. goods and services deficit was $77.6 billion in May 2026 — up $23.0 billion from a revised $54.6 billion in April. The headline percentage: +42.2%.
That number is accurate. It is also, in isolation, nearly useless.
The same release contains a second figure that almost no outlet led with: year-to-date, the goods and services deficit decreased $203.9 billion, or 40.6%, compared to the same period in 2025. Exports were up $164.7 billion (11.7%) year-to-date. Imports were down $39.2 billion (2.1%) year-to-date.
Two numbers from the same primary document. One says the deficit surged. One says the deficit collapsed. Both are correct. The question is which one describes the underlying economic reality better — and the answer is almost certainly not the month-over-month figure, which is notoriously volatile and explicitly flagged in the release as not statistically significant (the document marks the percentage changes with a degree symbol, noting "statistical significance is not applicable or not measurable").
The three-month moving average — a smoother signal — shows the average deficit at $62.9 billion for the period ending in May, up $7.5 billion from the prior period. That's a real increase, but it's a far cry from "42% surge."
Why the Monthly Number Keeps Winning the Headline
This is a methodology problem masquerading as a reporting problem. Month-to-month trade data is genuinely noisy. A single large shipment of nonmonetary gold — which the Census Bureau release specifically flags as a major driver, down $6.2 billion in May exports — can swing the headline number by several percentage points. These aren't signals about the direction of trade policy. They're artifacts of how goods move.
The year-to-date comparison controls for this. It uses a longer window, smooths out the gold shipments and the seasonal quirks, and compares like-to-like across a full business cycle. It is, by any reasonable statistical standard, the more informative number. It is also, reliably, the number that gets buried.
The reason isn't conspiracy. It's incentive structure. A 42% monthly jump is a story. A 40% year-to-date decline is context. Context doesn't get clicks. Context doesn't fit in a chyron.
What the Tariff Narrative Needs From This Data
The trade deficit numbers are doing double duty right now. They're being read not just as economic indicators but as scorecards for tariff policy — evidence that the trade war is working, or isn't, depending on which number you pick up.
ProPublica's reporting on the tariff war's effects in northern Michigan illustrates how the aggregate numbers obscure community-level damage. Traffic over the Sault Ste. Marie International Bridge is "way down," per that reporting, and local businesses are absorbing costs that don't show up cleanly in a national deficit figure. The year-to-date deficit improvement looks like a win from 30,000 feet. At the bridge, it looks different.
This is the denominator problem in its most consequential form: the national aggregate and the local reality are both true, and neither one fully describes the other. Using the national number to dismiss local harm is as misleading as using local harm to claim the national picture is catastrophic.
Watch the August 4 Release
Tomorrow morning, the Census Bureau and BEA release June trade data. Based on the pattern so far in 2026, here's what to look for:
The monthly change will get the headline. It will be presented as a verdict on tariff policy. Reuters Fact Check has documented repeatedly how single-figure claims circulate fastest when they confirm a pre-existing narrative — and a big monthly deficit number fits the tariff-war story too cleanly to resist.
The year-to-date figure will tell you whether the January–June trend holds. If the cumulative deficit is still running well below the 2025 pace, the monthly number is noise. If the year-to-date gap has narrowed significantly, something real may be shifting.
The goods deficit specifically — which the Census Bureau's May release put at $106.5 billion for the month — is where tariff effects would show up most directly. Watch whether imports of industrial supplies and capital goods are moving, not just the gold-sensitive categories.
The 42.2% figure was real. It was also the least informative number in the release. Tomorrow we get another chance to see which number the headlines choose.


