


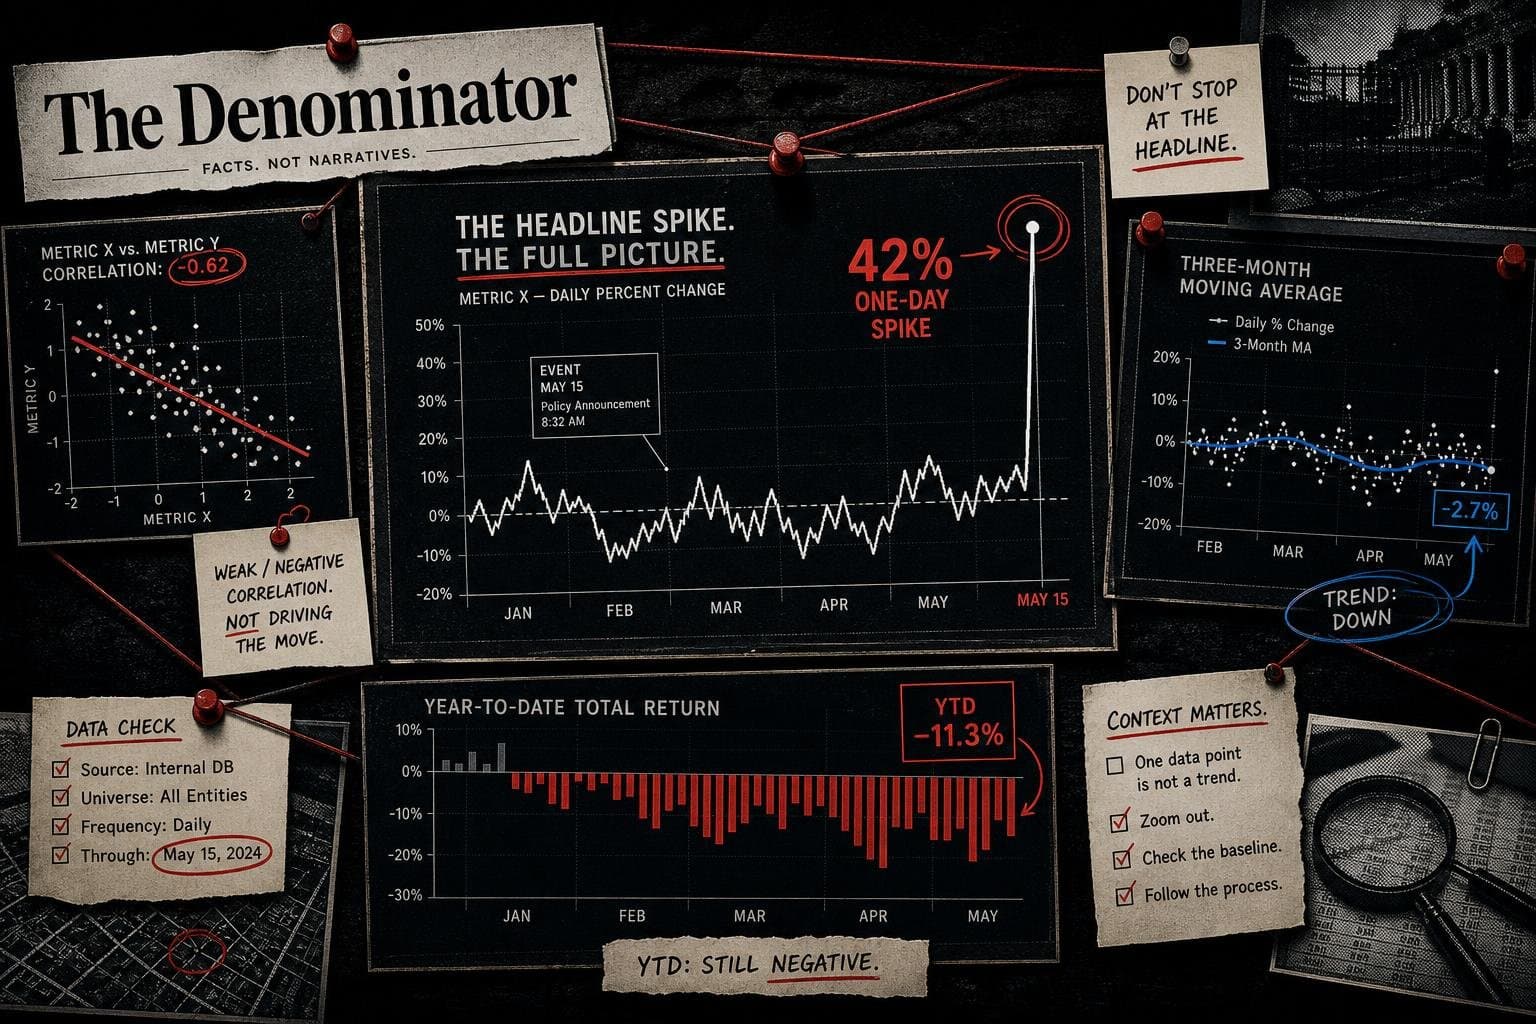

I covered this number three weeks ago. The May trade data hasn't changed — but the way it keeps getting cited has, and the denominator problem is getting worse, not better.
Here's the short version of what the data actually says, and the five framing errors that keep appearing around it.
1. The 42% headline is a month-over-month number, not a trend
The goods and services deficit was $77.6 billion in May, up $23.0 billion from $54.6 billion in April. That's a 42.2% jump. It's also a single-month comparison to a single prior month. One data point is not a trend. Two data points are barely a trend. The release itself flags this: statistical significance "is not applicable or not measurable" for the percentage changes.
2. The year-to-date number runs in the opposite direction
This is the part that keeps getting dropped. Year-to-date through May 2026, the goods and services deficit decreased $203.9 billion — a 40.6% decline — compared to the same period in 2025. Exports are up $164.7 billion (11.7%) year-to-date. Imports are down $39.2 billion (2.1%) year-to-date.
You can write a story about a single bad month. You can write a story about a dramatically improved year. You cannot honestly write both without noting the contradiction.
3. The three-month moving average tells a third story
The three-month moving average deficit through May was $62.9 billion — up $7.5 billion from the prior three-month period, but down $23.8 billion year-over-year from the three months ending May 2025. The moving average exists precisely to smooth out the kind of single-month spike that generated the 42% headline. It's in the same document. It rarely gets cited.
4. The goods deficit and the services surplus are being collapsed
The May increase in the overall deficit reflected an increase in the goods deficit of $23.6 billion to $106.5 billion, partially offset by an increase in the services surplus of $0.6 billion to $28.9 billion. These move differently, respond to different policy levers, and mean different things for different industries. The BLS release calendar is a useful reminder of how many distinct economic series feed into a single "economy is doing X" headline — trade, employment, prices, and earnings all drop on separate schedules and measure separate things. Aggregating them into one deficit number and then treating that number as a single policy signal is how you end up with arguments that don't connect to the actual data.
5. The export drop is being misread as demand collapse
May exports were $317.7 billion, down $10.5 billion from April. The goods breakdown shows the decline was driven largely by industrial supplies and materials — specifically, nonmonetary gold fell $6.2 billion and other precious metals also declined. Gold export volumes are notoriously volatile and tell you almost nothing about underlying trade demand. Stripping out precious metals swings is standard practice in trade analysis. It is not standard practice in trade headlines.
The same selective-window problem shows up across economic data. The Census Bureau's Business Trends and Outlook Survey — a sample of approximately 1.2 million businesses, collected biweekly — exists precisely because single-month snapshots miss the texture of what's actually happening in the economy. The BTOS methodology is worth understanding: ~200,000 businesses per panel, reporting every 12 weeks, covering revenues, employees, hours, and inventories. That's the kind of denominator context that monthly trade headlines routinely skip.
What to watch on August 4
The next trade release is scheduled for Tuesday, August 4, 2026, covering June data. That's the