


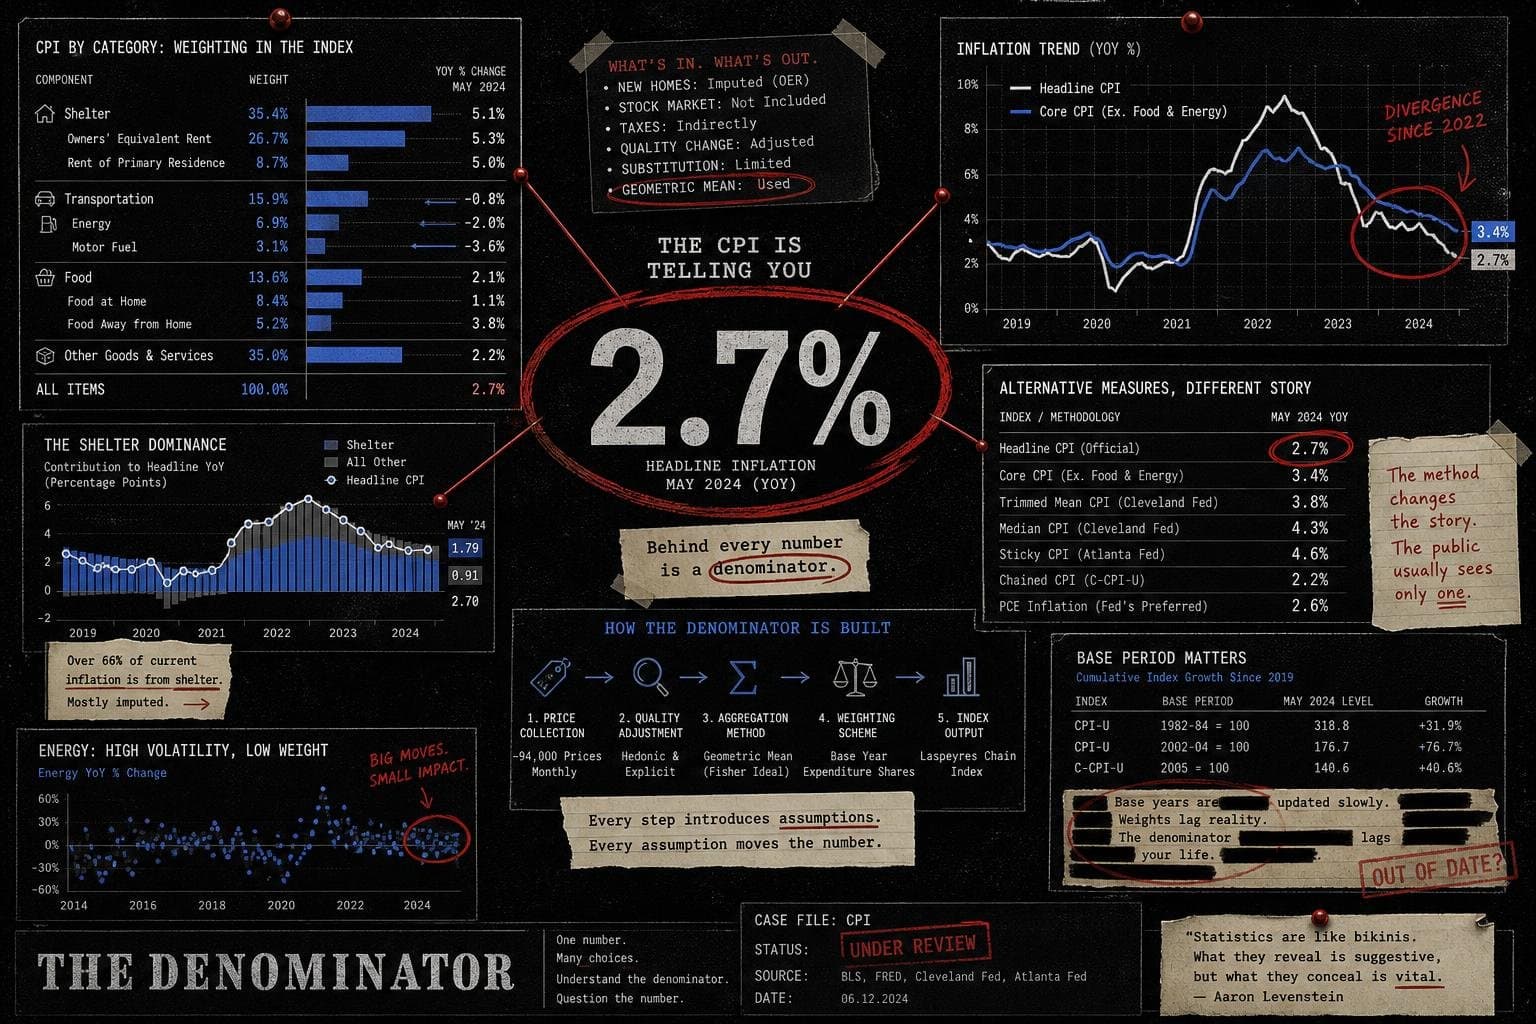

The Bureau of Labor Statistics dropped the June 2026 CPI release yesterday. The headline number will circulate as "inflation at 2.7%" or "inflation cooling" or "inflation still too high," depending on which cable chyron you catch. All three framings can technically be true. That's the problem.
Here's what the number actually contains — and what it doesn't.
1. "2.7%" Is a Year-Over-Year Figure. The Starting Point Matters.
When you see a CPI percentage without a time window, the number is incomplete. BLS reports the Consumer Price Index for All Urban Consumers (CPI-U) — a measure covering roughly 93% of the U.S. population. The year-over-year framing compares June 2026 to June 2025.
What happened in June 2025? If that base period was already elevated from prior shocks, a "cooling" headline can mask prices that are still historically high in absolute terms. Year-over-year change and price level are different things. The first tells you the rate of acceleration; the second tells you where you actually are. Most headlines report the first and imply the second.
2. The CPI-U Is a Weighted Average. The Weights Are Doing Work.
The index is constructed from a basket of goods and services, each weighted by how much urban consumers spend on it. Housing (shelter) carries the largest single weight. Energy and food are tracked separately because they're volatile.
This matters because:
- Core CPI (which strips out food and energy) and headline CPI can diverge significantly in any given month.
- A household that spends more than average on rent, groceries, or gasoline experiences a different effective inflation rate than the index reports.
- The BLS methodology is sound and transparent — but "inflation is 2.7%" applied universally to all households is a statistical average, not a personal experience.
The BLS release publishes the component breakdown. Anyone citing only the headline number without noting which components drove it is giving you the answer without the work.
3. Precision on Inflation Numbers Has Consequences Beyond the Headline
For a useful parallel in how forecasters handle this: the OECD's July 2026 Economic Survey of the United Kingdom projects UK inflation rising to 3.7% in 2026 from 3.4% in 2025, before easing to 2.4% in 2027. Those are point estimates from a modeling exercise — the OECD publishes them with surrounding analysis about energy price volatility and fiscal pressures that explain the forecast's assumptions.
The number alone (3.7%) tells you almost nothing. The OECD's framing — that high and volatile energy prices, rising fiscal pressures, and weak productivity growth continue to weigh on living standards — tells you what to watch. That's the difference between a data point and an analysis.
Most inflation headlines give you the 3.7. They skip the energy prices.
4. "Compared to What?" Is Still the Right Question
Three things worth checking whenever a CPI number circulates:
- Which index? CPI-U, CPI-W (wage earners), and Chained CPI produce different numbers for the same period. They're not interchangeable.
- Which window? Month-over-month, year-over-year, and cumulative since a reference year tell different stories. A 2.7% annual rate sounds moderate; cumulative price increases since 2020 look very different.
- Which components? Shelter inflation, services inflation, and goods deflation can all coexist inside a single headline number. The component breakdown is in the primary release — the press summary often omits it.
This pattern — a real number, stripped of its methodological context and recirculated as a verdict — is exactly what Reuters Fact Check tracks when viral claims outrun their source data. The CPI headline isn't misinformation. It's an accurate number doing the work of a more complete answer.
The Takeaway
The June CPI number is real data from a cred