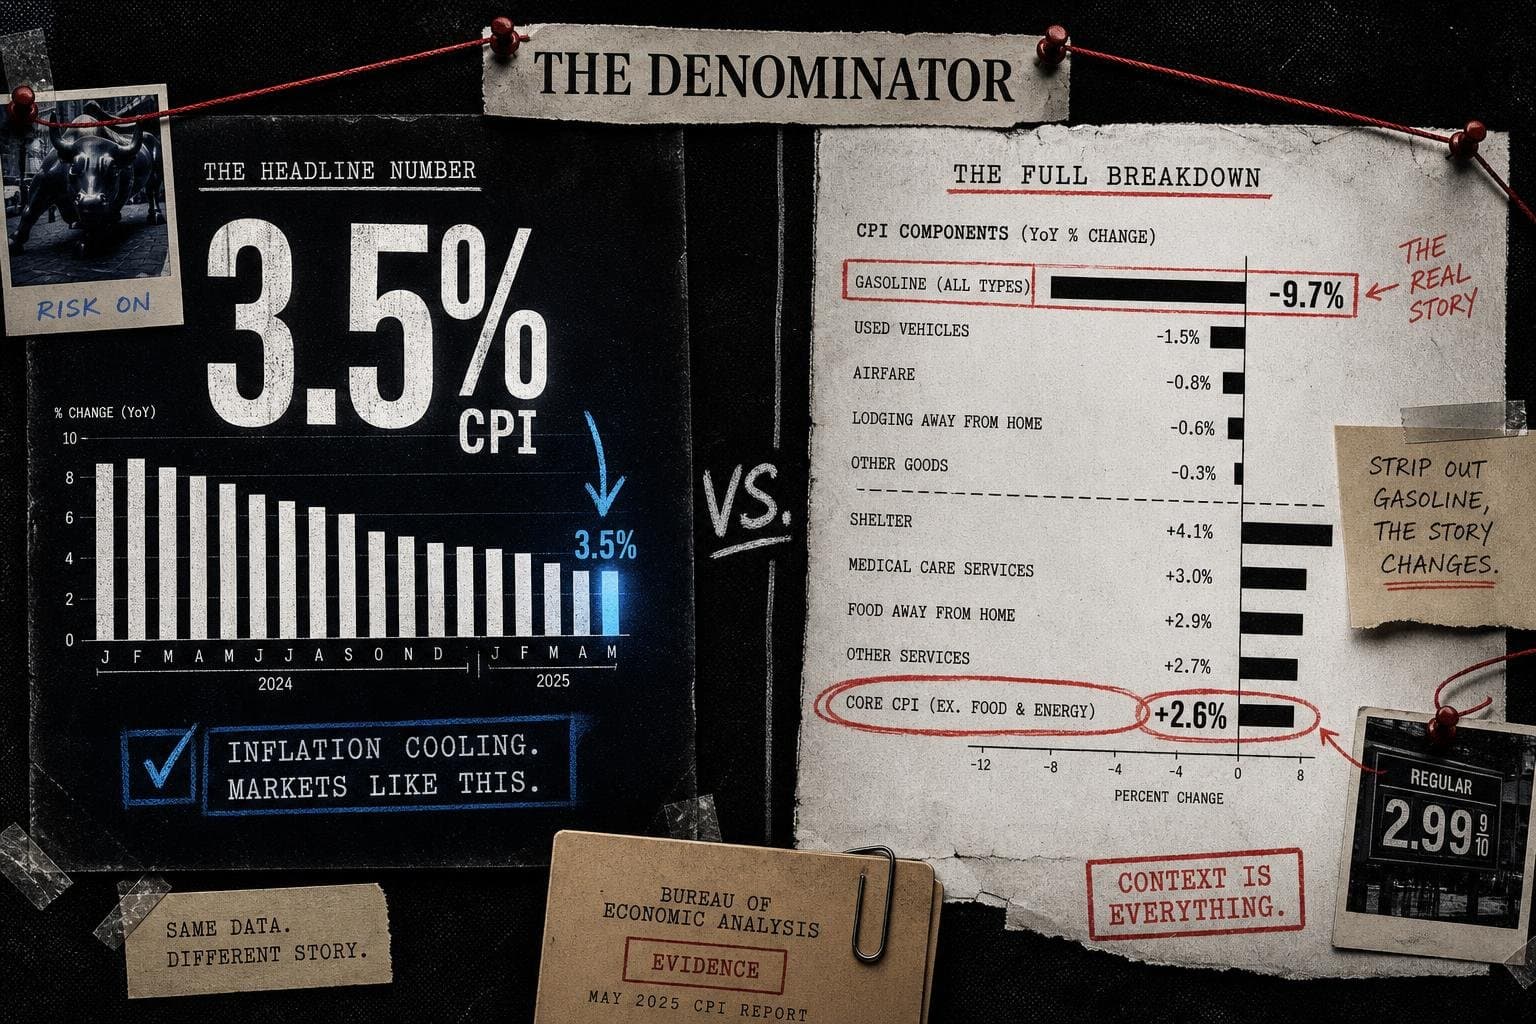

The June CPI release landed on July 14 with a headline that most outlets treated as good news: inflation at 3.5% year-over-year, below the 3.8% that markets had expected. Reuters called it a moderation "more than expected." Stocks moved. Fed watchers updated their models.
Here's what most of the coverage skipped: there are two inflation numbers in that release, and they tell different stories. Choosing which one to lead with isn't a neutral editorial decision. It's an argument dressed up as a data point.
The Gasoline Line Is Doing Almost All the Work
The BLS data table is worth reading in full, because the composition of that 3.5% headline is not evenly distributed. Gasoline prices fell 9.7% in June on a seasonally adjusted monthly basis — the single largest one-month swing in the table. Energy commodities as a whole dropped 9.5% in June. That collapse in energy prices is the primary reason the all-items index came in below expectations.
Strip out food and energy — the "core" CPI that the Fed actually watches when setting rate policy — and the June number is 2.6% year-over-year. Not 3.5%. The all-items headline is 35% higher than the core figure, and the gap is almost entirely explained by one volatile commodity that had an unusually large monthly drop.
This isn't a methodological trick. Core CPI exists precisely because energy prices are noisy — they spike, they crash, they spike again, and none of that volatility tells you much about the underlying price pressures that monetary policy can actually address. The Fed has said explicitly it watches core. Reporting the headline as the number without noting what's driving it is like reporting a company's revenue without mentioning that a one-time asset sale accounts for most of the quarterly gain.
The Monthly Trend Has Been Running Hot Since March
The year-over-year framing also obscures something the monthly data makes visible. Look at the seasonally adjusted month-over-month changes since the start of 2026: +0.2% in January, +0.3% in February, then +0.9% in March, +0.6% in April, +0.5% in May. That's three consecutive months of accelerating monthly inflation before June's -0.4% reversal. The reversal is real — but it's almost entirely the gasoline effect running in reverse.
The year-over-year number smooths all of that out into a single figure that looks like a gentle trend. It isn't. The underlying monthly sequence from March through May was a meaningful acceleration, and June's apparent relief came from energy prices giving back gains, not from shelter, services, or food costs cooling off. Shelter — which carries substantial weight in the index — rose 0.1% in June and is up 3.3% over the past twelve months, per the BLS release. Food away from home is up 3.4% over the same window. Neither of those moved in a direction that suggests the underlying pressure is resolving.
"Below Expectations" Is a Comparison to a Forecast, Not to a Target
There's a third framing problem worth naming. "Below expectations" is not the same as "good." Market expectations for the June CPI were 3.8%. The actual print was 3.5%. That's a beat — relative to a forecast. The Fed's stated inflation target is 2%. The June all-items CPI is 75% above that target. The core CPI is 30% above it.
Reuters reported that the moderation was "insufficient to convince financial markets to take an interest rate increase from the Federal Reserve this year off the table," and that Fed Chair Kevin Warsh told lawmakers the central bank had "no tolerance for persistently elevated" inflation. That's the real context. The June number didn't close the gap to target — it just came in lower than analysts guessed it would.
"Below expectations" as a headline framing compares the data to a forecast. "Inflation moderates" compares it to last month. Neither comparison is to the number that actually matters for policy: 2%. The BLS release schedule has additional price data due before the Fed's July meeting — those prints will matter more than June's gasoline-driven dip.
Meanwhile, the housing market offers a useful parallel. Existing home sales fell 2.4% in June to a 4.09 million-unit annual rate, with the median price hitting a record $440,600 — up 1.8% from a year earlier. Shelter costs in the CPI and home prices in the housing market are telling the same story: the sticky, non-energy components of the cost of living are not cooling. The Census Bureau's upcoming county-level internet adoption estimates and other household data releases scheduled for late July will add more texture to that picture.
I covered the June CPI revision two weeks ago — the one that quietly moved the preliminary 2.7% print to 3.5%. That revision was the story then. Now the 3.5% is confirmed, and the story is how it's being framed. The number didn't change. The framing did. And the framing is doing a lot of work.
The question worth sitting with before the next release: when gasoline prices eventually stop falling — or start rising again — which CPI number will the headlines reach for?


