


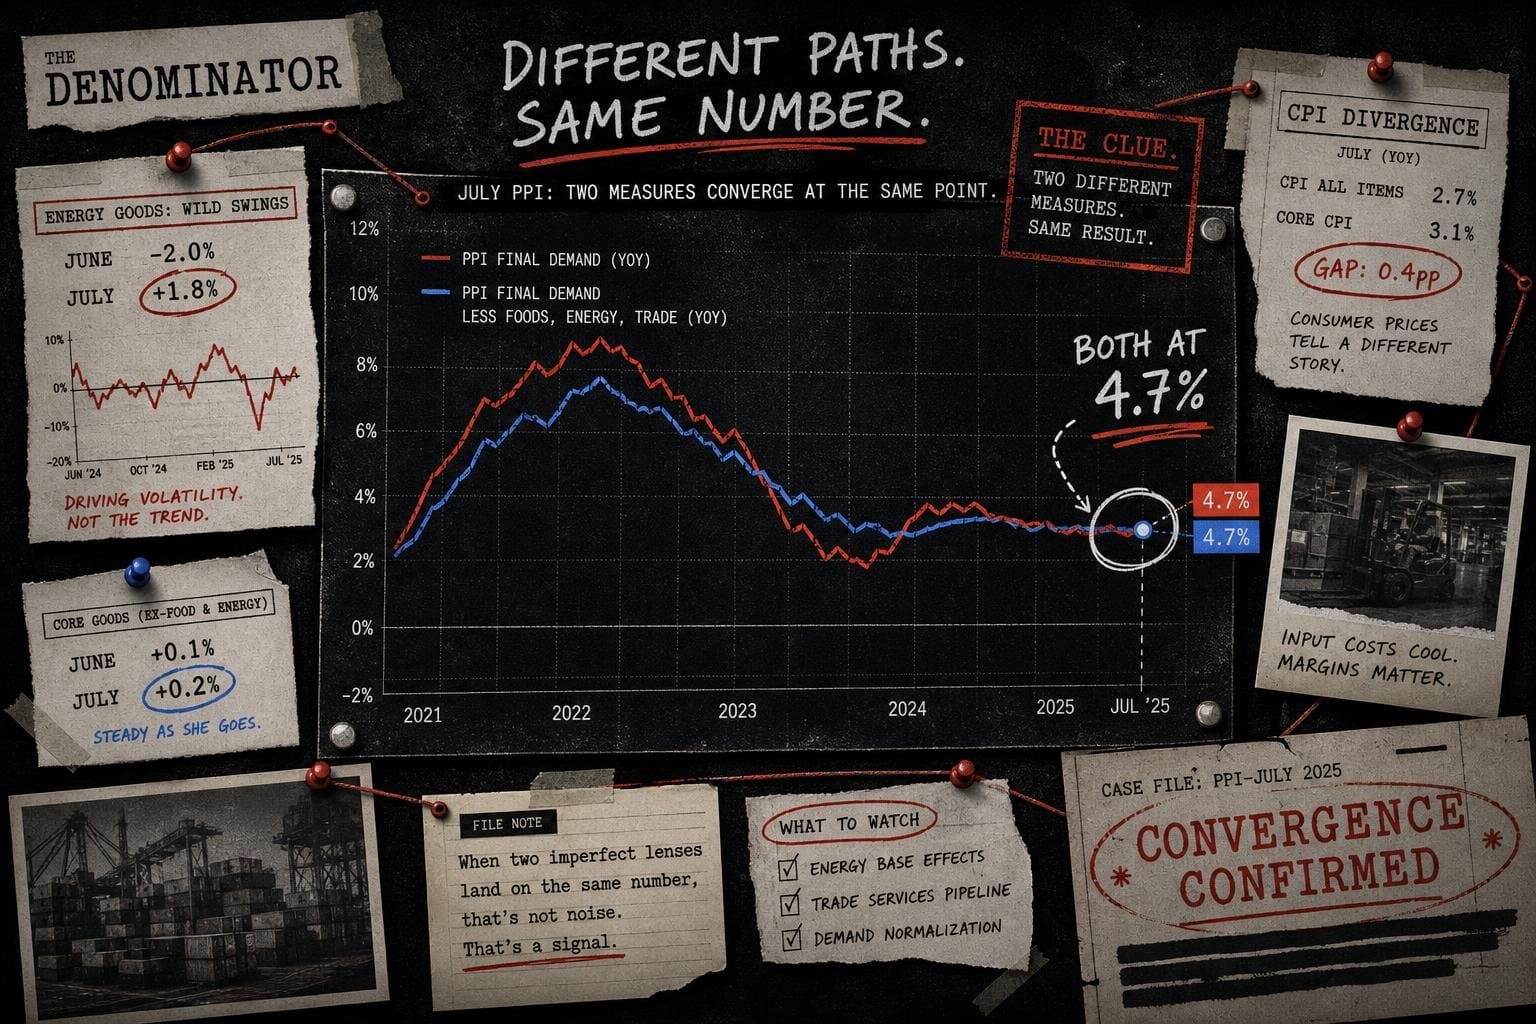

A coincidence worth examining: the July Producer Price Index came in at 4.7% year-over-year for total final demand. The "core" PPI — final demand less foods, energy, and trade — also came in at 4.7% year-over-year. Same number, different baskets. That symmetry is almost aesthetically pleasing. It is also hiding something important about where producer-side inflation is actually sitting right now.
The Headline Number Is Doing Less Work Than It Looks Like
The 4.7% total final demand figure for July 2026 represents a meaningful deceleration from the spring peak. BLS data shows total final demand running at 5.7% year-over-year in April, 5.9% in May, and 5.5% in June before dropping to 4.7% in July. That's a genuine move in the right direction — roughly 1.2 percentage points of deceleration over three months.
But here's what the headline obscures: the deceleration is almost entirely an energy story. Final demand energy goods swung from +8.2% month-over-month in May to -6.5% in June to -3.1% in July. Energy is doing the heavy lifting on the way down, just as it did the heavy lifting on the way up. In March, energy goods surged 10.5% in a single month. In April, another 7.2%. The tariff shock hit energy-intensive supply chains hard, and now some of that is unwinding — the same dynamic visible in Reuters coverage of the broader commodity and trade disruption that followed the spring policy moves.
Strip energy out, and the picture is less reassuring. The core PPI — final demand less foods, energy, and trade — has been sitting at 4.7% year-over-year for two consecutive months. It was 5.0% in both May and June. So core producer prices are decelerating too, but more slowly, and from a higher base than the headline number suggests.
The CPI Divergence Is the Real Story
Here's where it gets interesting. The July CPI came in at 3.4% year-over-year for all items. The PPI for total final demand came in at 4.7%. That's a 1.3 percentage point gap between what producers are paying and what consumers are seeing at the register.
Gaps like this don't persist indefinitely. Either producers absorb the margin compression — which shows up eventually in earnings and investment — or they pass costs through, which shows up eventually in consumer prices. The direction of that resolution matters enormously for where CPI goes from here. It's the kind of structural pressure that the Census Bureau's economic indicators track through downstream measures like retail trade and manufacturing shipments — data that will start reflecting this squeeze in coming months.
The CPI data offers a clue about where the pressure is building. Core CPI — all items less food and energy — ran at just 2.5% year-over-year in July. Services less energy services ran at 3.0%. These are relatively contained. But energy in the consumer basket is up 14.7% year-over-year, with gasoline up 24.6% and fuel oil up 39.1% over the same window. The consumer-side energy number is still enormous even as the producer-side energy number is now falling month-over-month.
That lag matters. Consumer energy prices tend to follow producer energy prices with a delay. If the PPI energy deceleration is real and sustained, CPI energy should follow — which would pull the headline CPI number down meaningfully in coming months. But "if" and "sustained" are doing a lot of work in that sentence. The spring tariff shock created a spike; the summer reversal may be partial.
What "Compared to What?" Looks Like in Practice
The instinct when a number decelerates is to call it good news. And 4.7% down from 5.9% is, arithmetically, an improvement. But the comparison year matters enormously here.
The July 2025 PPI year-over-year figure was 3.2%. We are now running 1.5 percentage points above that baseline, measured over the same 12-month window. The deceleration from spring's peak is real; the return to pre-tariff conditions is not.
The more useful frame: the tariff shock appears to have added roughly 2-3 percentage points to producer-side inflation at its peak (comparing the April-May 2026 readings of 5.7-5.9% against the pre-tariff 2025 baseline of roughly 3%). Some of that is now unwinding through energy. The structural component — core PPI at 4.7% versus a 2025 baseline that ran closer to 3.4-3.6% — has not unwound. This is the kind of pass-through risk that regulators nominally watch for; the CFPB's current posture of asking companies to self-report compliance, as ProPublica has reported, suggests the consumer-side institutional guardrails are thinner than they were the last time producer costs ran this far ahead of retail prices.
Watch the August PPI release for whether core holds at 4.7% or continues its slower deceleration. If it stalls, the margin compression story becomes the earnings story of Q3. If it breaks lower, the CPI path gets cleaner. The numbers will tell you which one it is. The headline won't.