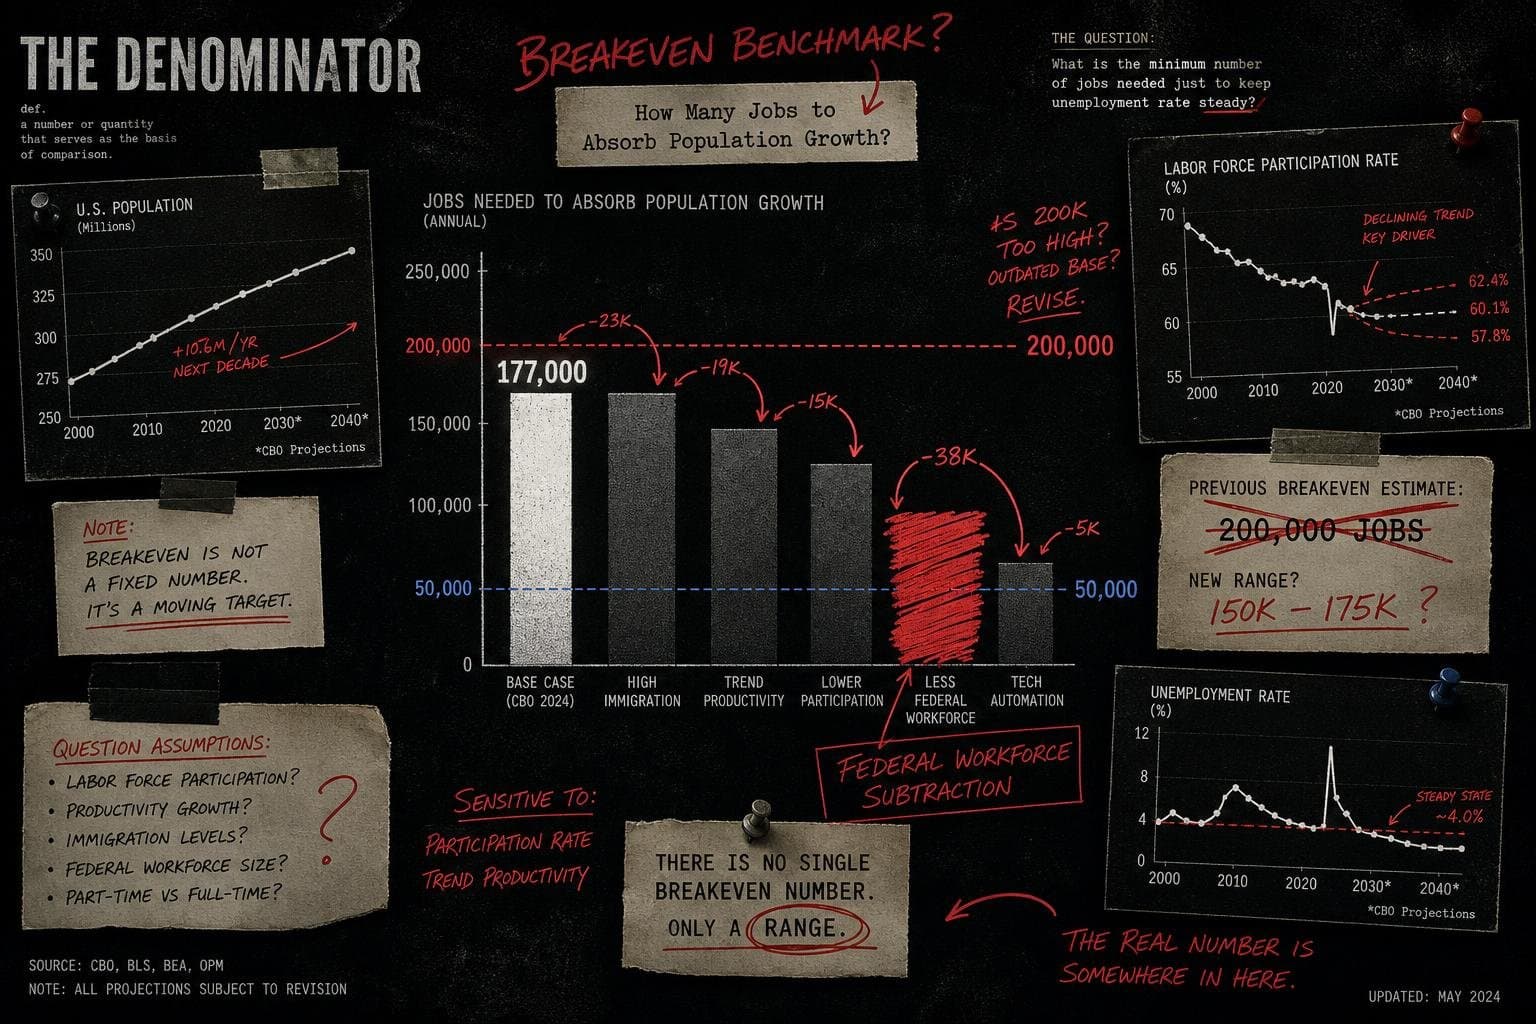

Every month, the first Friday delivers a single number that gets treated like a verdict. This month's verdict: 177,000 nonfarm payroll jobs added in July 2026, per the Bureau of Labor Statistics. The headlines called it a "solid beat." Commentators exhaled. Markets moved.
Here's the problem: 177,000 compared to what?
That question — the one this publication exists to ask — turns out to be genuinely complicated right now, in a way that most of the coverage is skipping entirely. The breakeven number, the benchmark against which any monthly payroll figure should be judged, is itself uncertain. And the reason it's uncertain reveals something important about how labor market statistics get made, and how easily they can mislead even careful readers.
The Breakeven Isn't a Fact. It's a Calculation With Four Moving Parts.
The breakeven payroll number answers a deceptively simple question: how many jobs does the economy need to add each month to keep the unemployment rate stable? If you're above the breakeven, the labor market is tightening. Below it, loosening. The number sounds like it should be fixed — a known quantity you can look up. It isn't.
A Chicago Fed analysis published this year lays out the four inputs required to calculate it: the size of the working-age population (the civilian noninstitutionalized population age 16 and over), the long-term trend in labor force participation, the natural rate of unemployment, and an adjustment for the gap between two different BLS employment measures. Change any one of those inputs and the breakeven shifts.
In normal times, the Chicago Fed researchers note, the population input is stable enough that this doesn't matter much. But beginning in 2020, it stopped being stable. The post-pandemic immigration surge created substantial uncertainty about the actual size of the working-age population in real time. The researchers found that during 2022–24, real-time readings of how "hot" the labor market was running were overstated relative to what subsequent population revisions implied. In other words: the labor market looked tighter than it actually was, because the denominator — the population base — was being underestimated.
That's not a small methodological footnote. It means that the breakeven benchmark used to evaluate monthly payroll numbers was itself miscalibrated during a period when the Federal Reserve was making consequential interest rate decisions based on those readings. The Chicago Fed's analysis cites Dallas Fed work (Cheremukhin, 2025; Cheremukhin et al., 2026) suggesting the breakeven has fallen from above 200,000 during its 2022–24 peak, and that the more modest payroll gains of fewer than 50,000 a month in the second half of 2025 were therefore consistent with a balanced labor market — not the weak one the raw numbers implied.
So when you see 177,000 and think "solid," you're implicitly comparing it to a benchmark. The question is which one.
The Federal Workforce Subtraction Is Doing Enormous Work in the Headline Number
Set the breakeven question aside for a moment and look at the composition of July's 177,000. The BLS Employment Situation release is the primary source here, but the compositional picture becomes clearer when you look at the trend data assembled by FactCheck.org's July 2026 update.
FactCheck's analysis documents that between January 2025 and June 2026 — Trump's first 17 months — total nonfarm employment rose by 716,000. Federal government employment fell by 324,000, or 10.8%, over that same period. That means federal job losses account for roughly 45% of the gap between total job growth and private-sector job growth during this stretch. Private-sector employment added 902,000 jobs over the 17 months — a real number, but still well below the 1,357,000 private-sector jobs added in the preceding 17 months of the Biden administration.
The point here is arithmetic, not politics. When you see a headline payroll number, it aggregates federal, state, local, and private employment. A month where private employers add 200,000 jobs but the federal government cuts 50,000 produces a headline of 150,000 — which reads as weak, even though the private economy is doing something different from what the aggregate suggests. Conversely, a month where private hiring slows but federal cuts also slow produces a headline that looks stable. The denominator problem here is definitional: "jobs added" is a net figure across sectors with very different dynamics.
Manufacturing is worth flagging separately. The FactCheck data shows a loss of 75,000 manufacturing jobs during Trump's first 17 months, following a loss of 188,000 in the preceding 17 months. Both periods show decline. The tariff-driven "flood of factory jobs" predicted on Liberation Day, April 2, 2025, has not materialized in the aggregate data — though the BLS release would need to be read at the sector level to assess July specifically.
The JOLTS Data Adds a Layer the Headline Number Misses
The payroll number tells you how many jobs were added. The Job Openings and Labor Turnover Survey for June 2026, released earlier this week, tells you something about the underlying dynamics: how many positions employers are trying to fill, how many workers are quitting voluntarily, and how many are being laid off.
I wrote about the JOLTS internals in the last issue, specifically about which sectors the headline opening count was hiding. The June data is worth reading alongside July's payroll number because JOLTS is a leading indicator — it reflects employer intentions in June, which feed into hiring decisions that show up in July payrolls. A labor market where job openings are declining but payrolls are still growing is a labor market running on existing momentum, not new demand. Whether that's the pattern here requires reading the JOLTS release at the sector level, which the truncated source excerpt doesn't fully support — so I'll flag it as the right question to ask rather than assert an answer.
What the JOLTS framework does clarify is that the quit rate matters as much as the opening rate. Workers quit voluntarily when they're confident they can find something better. When quit rates fall, it signals that workers feel less mobile — which is a different kind of labor market softness than layoffs, and one that doesn't show up in the unemployment rate at all. The unemployment rate only counts people actively looking for work. Workers who've stopped looking, or who've stayed in jobs they'd otherwise leave, are invisible to it.
The Unemployment Rate Has a Population Problem Too
The BLS release reports an unemployment rate for July, but that number carries the same population uncertainty the Chicago Fed identified. The unemployment rate is calculated from the Current Population Survey — a household survey, separate from the payroll survey — and its denominator is the labor force, which is itself a function of who's counted as working-age and who's counted as participating.
The FactCheck July update notes that the labor force participation rate declined during Trump's term so far. A declining participation rate, holding payrolls roughly steady, mechanically reduces the unemployment rate — because people who leave the labor force aren't counted as unemployed. This is the denominator trick hiding in plain sight inside the most-cited labor market statistic in American public life.
The Chicago Fed's framework makes this explicit: the breakeven calculation requires an estimate of the trend labor force participation rate, not just the current one. If participation is declining for structural reasons — aging population, disability, discouragement — the breakeven falls. If it's declining because workers can't find jobs and have given up, the breakeven should stay higher, because those workers represent latent labor supply that could return. Distinguishing between these two stories requires data that the headline unemployment rate simply doesn't contain.
The Cleveland Fed's inflation nowcasting tool is relevant context here: wage growth and inflation interact with labor market tightness in ways that the payroll number alone can't capture. A labor market that looks "solid" at 177,000 jobs but is generating wage growth below inflation is a labor market where workers are falling behind in real terms, regardless of what the headline says.
What the 177,000 Actually Tells You — and What It Doesn't
Here's the honest accounting. The July payroll number of 177,000 tells you that, on net, the U.S. economy added approximately that many jobs last month across all sectors, seasonally adjusted. It does not tell you:
- Whether that's above or below the breakeven, because the breakeven is uncertain and has been revised substantially as population estimates have improved
- How the private sector performed relative to government sector changes, without reading the sector breakdown
- Whether the labor market is tightening or loosening, because that requires comparing to a breakeven that itself depends on population growth assumptions that were systematically wrong during 2022–24
- Whether workers are better or worse off, because real wage growth requires inflation data alongside payroll data
- Whether the trend is improving or deteriorating, because a single month is noise
The number that's missing from almost every headline is the one the Chicago Fed researchers are trying to calculate: a population-adjusted breakeven that accounts for the immigration surge's effect on working-age population estimates. Their finding — that real-time labor market readings were overstated during 2022–24 because the population denominator was underestimated — should make everyone more humble about what real-time readings are telling us right now.
The 177,000 is a real number. It's carefully measured by a professional statistical agency that has, despite recent political pressure, continued to publish its data. What it isn't is a verdict. It's an input into a calculation that requires a denominator — and right now, that denominator is less certain than the confidence of the headlines suggests.
Watch for the annual BLS benchmarking revision, which will eventually reconcile the payroll survey against state unemployment insurance records. That revision, not the monthly release, is where the real-time picture gets corrected. The last one, in February, revised Biden-era figures downward. The next one will do the same for the current period — in one direction or another. That's the number worth waiting for.


