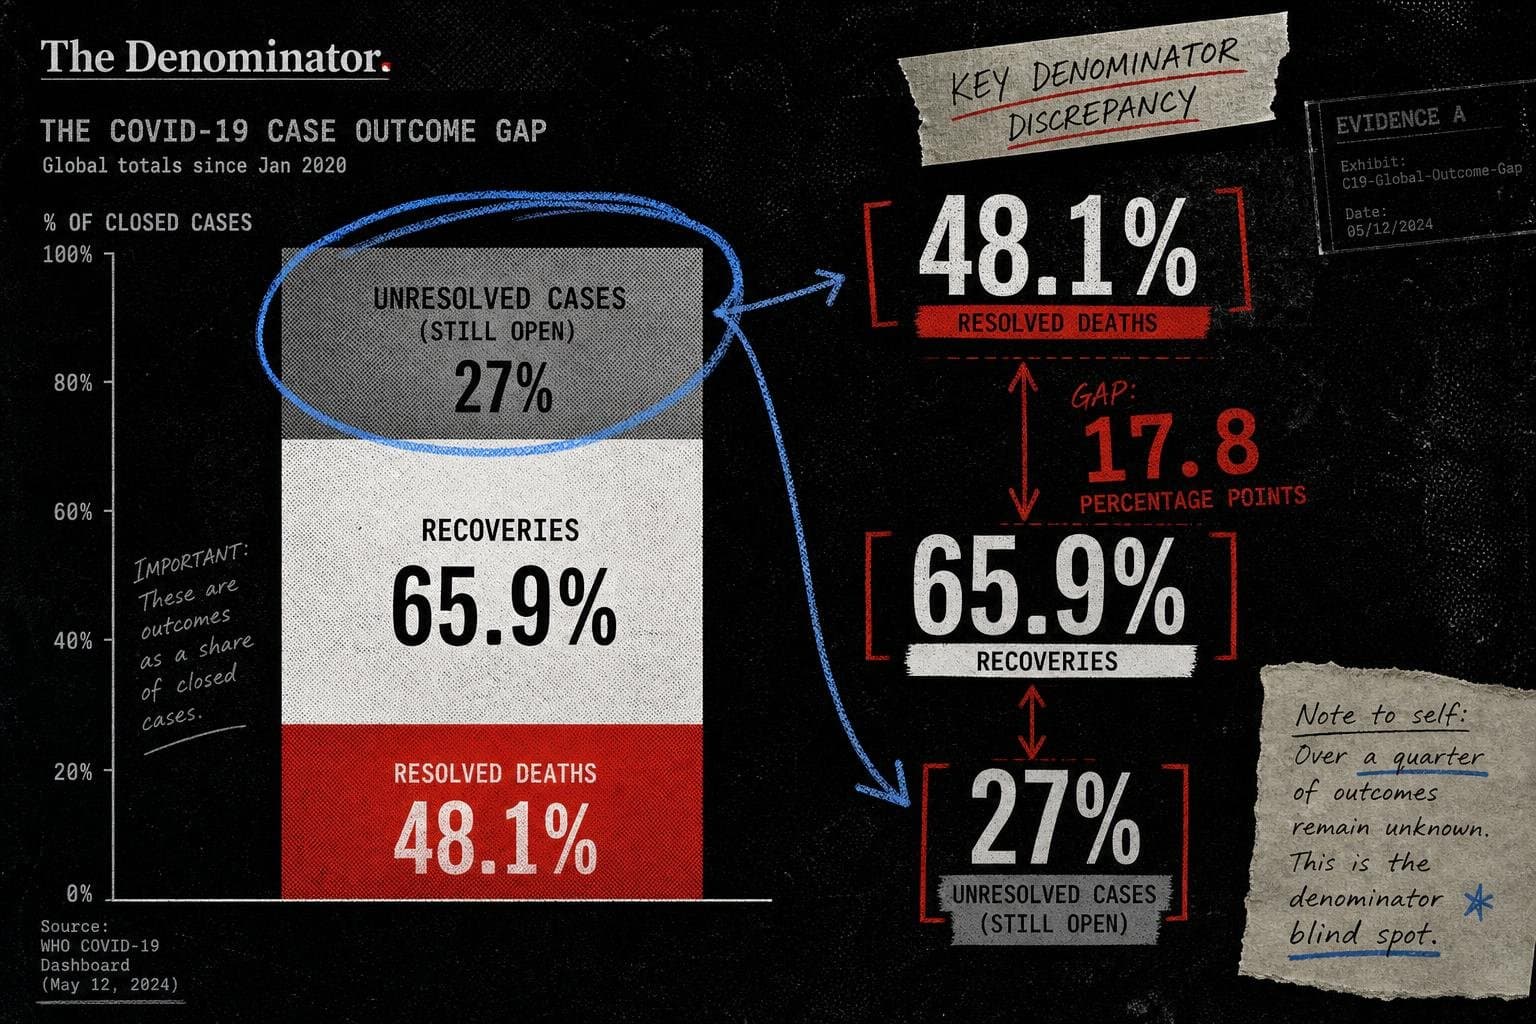

Here's a number that sounds damning: the case fatality rate for the Ebola outbreak caused by Bundibugyo virus in the Democratic Republic of the Congo now stands at 48.1%, according to WHO's latest Disease Outbreak News. Nearly one in two confirmed cases has died. That's a brutal statistic, and it's the one circulating in most summaries of this outbreak.
It's also not quite the number you think it is.
I've been tracking this outbreak's case fatality rate since it sat at 39% in July, then 45.9% in August. Each time, the headline framing treated the CFR as a fixed property of the disease — as if 48.1% tells you how dangerous Bundibugyo virus is, full stop. It doesn't. It tells you how dangerous the disease has been among cases whose outcomes are known, mixed in with a large pool of cases whose outcomes aren't known yet. That distinction matters more now than it did in July, because the unresolved pool has grown.
The Math Behind the Headline Number
WHO's own report gives us everything we need to check this. As of 23 September 2026, the country has recorded 7,890 confirmed cases, 3,799 confirmed deaths, and 1,966 recoveries, per the WHO outbreak update. Add the deaths and the recoveries together and you get 5,765 cases with a known outcome. Subtract that from the total case count and you're left with 2,125 cases — 27% of all confirmed cases — still active or otherwise unresolved.
The published CFR of 48.1% divides deaths by the full 7,890 cases, unresolved ones included. But a meaningful share of those 2,125 open cases will eventually resolve as deaths, pulling the eventual rate higher, while the people being told "48.1%" today are hearing a number that's necessarily a lagging, partial picture. If you instead divide deaths only by resolved cases — 3,799 divided by 5,765 — you get 65.9%. That's not a more "correct" number so much as a different lens on the same incomplete dataset, and the gap between 48.1% and 65.9% is exactly the kind of denominator confusion this outbreak keeps generating.
This isn't a criticism of WHO's methodology. Case fatality rate calculated against all confirmed cases is a standard, defensible convention, and the agency's report is unusually transparent about the components — it gives you the deaths, the recoveries, and the total, so you can do this arithmetic yourself. That's more disclosure than most government statistical releases offer on a monthly cadence; compare it to how the Bureau of Labor Statistics structures its employment release, where every headline rate comes paired with the sample counts and revision notes needed to second-guess it. The problem with the Ebola number isn't the data, it's the downstream summary: when a wire brief says "CFR of 48.1%," most readers assume roughly half of everyone who gets this disease dies, when the real statement is narrower and messier — half of everyone counted so far, including thousands of people whose fates are still open.
A National Average Hiding Two Different Outbreaks
The aggregate trend line is also doing more concealing than revealing. Since the previous Disease Outbreak News on 11 September 2026, the country added 1,133 confirmed cases and 532 confirmed deaths, and WHO describes the seven-day moving average as showing "a resurgence in early September followed by a decline over the most recent reporting days," per WHO's report. Read as a single national curve, that sounds like an outbreak that spiked and is now subsiding.
But the agency is explicit that the national trend "conceals substantial variation in transmission intensity across affected provinces." Ituri, the original epicenter, has logged 6,032 cumulative cases with 868 reported in the most recent 21 days — still a lot of transmission, but declining gradually from its mid-August peak. North Kivu tells a different story: 1,480 cumulative cases, 567 of them in the last 21 days, reaching its highest incidence in mid-September before a recent decline. And North Kivu's case fatality rate — 59.7% — is running meaningfully higher than the national figure, with investigators still trying to pin down why.
That last point is worth sitting with, because it's the correlation-causation line doing its job properly. The report does not claim to know why North Kivu's CFR is higher — weaker health infrastructure, different patient demographics, delayed care-seeking, reporting artifacts from a province still ramping up surveillance, or some combination are all plausible. The honest answer right now is that nobody has isolated the mechanism. Treat the 59.7% figure as a flag for investigation, not an explanation in itself.
Sixty-Three Health Zones, One Number
Part of why this outbreak resists a single clean number is its geographic spread. Confirmed cases span 63 health zones in seven provinces, with 48 of those zones reporting at least one case in the preceding 21 days, per the same situation update. That's an outbreak that has, at various points, touched Ituri, North Kivu, Tshopo, Haut-Uélé, Bas-Uélé, South Kivu, and Sud Ubangi — provinces with different population densities, different distances from treatment centers, and almost certainly different reporting lag times between a case occurring and a case being confirmed and entered into the national count.
Haut-Uélé is showing "sustained transmission" below its late-August peak. Tshopo is showing "renewed transmission activity following a period of low incidence." South Kivu has reported no new cases since 29 May 2026. Three different trajectories, inside one national denominator. When you average a declining epicenter, a resurging second front, and a dormant tail into one CFR and one incidence curve, you get a number that's technically accurate and analytically almost useless for anyone trying to figure out where the outbreak is actually heading next.
The Pattern Isn't Unique to Epidemiology
I keep running into this same shape of problem in economic data, which is reassuring in a grim way — it means the mistake isn't specific to outbreak reporting, it's a generic failure to ask what's inside the aggregate. The August JOLTS release shows total job openings at 7,079,000 for August 2026, down from 7,335,000 in July 2026 but up from 6,919,000 a year earlier — a single headline figure that, like the Ebola CFR, blends sectors moving in opposite directions: health care openings fell from 1,474,000 in July to 1,359,000 in August, while retail trade openings rose from 707,000 to 761,000 over the same month. Nobody would report "job openings are up" or "down" without specifying the comparison period, and the same discipline is owed to a disease statistic that changes meaning depending on how many cases are still unresolved.
The same lesson shows up in trade data. The Census Bureau's international trade release reports monthly goods and services figures that, taken as a single month's swing, can look alarming or reassuring depending entirely on which month you anchor to — a pattern familiar to anyone who's watched a single-month trade deficit headline get walked back by the year-to-date trend a few weeks later. And in markets commentary, Reuters' coverage of Fed Chair Kevin Warsh noted that a Bank of America survey of roughly 170 global fund managers found the share expecting no rate rise before November fell from 75% the prior month to about 52% — a shift that only means something once you know it's measured against a specific prior survey window, not against some timeless baseline of investor sentiment.
For contrast, it's worth noting when an institution gets the denominator framing right from the start. WHO's own midpoint report on the UN Decade of Healthy Ageing, released September 28, states plainly that the gap between life expectancy and healthy life expectancy at age 60 widened between 2000 and 2023 — a specified seventeen-year window, not a vague "trend" — and separately that an estimated 71% of excess COVID-19 deaths between 2020 and 2023 occurred among people 60 and over, again with the window stated up front. That kind of explicit time-bounding is the same standard international statistical bodies like the OECD try to enforce across their comparative datasets, precisely because cross-country or cross-period comparisons collapse the moment the base period goes unstated. The Ebola DON gives you the raw components to do that work yourself; the ageing report just does the work for you in the text.
What to Watch
WHO typically issues a new Disease Outbreak News update every two to three weeks; based on the September 11 and September 23 cadence, the next one should land in mid-October. When it does, the number worth tracking isn't the topline CFR — it's whether the unresolved case pool (currently 2,125, or 27% of the total) shrinks as a share of total cases. If it does, the 48.1% figure will start converging with reality rather than lagging behind it. If North Kivu's elevated CFR persists once its own caseload resolves further, that's the signal worth a dedicated investigation, not a one-line caveat buried in a situation report.


