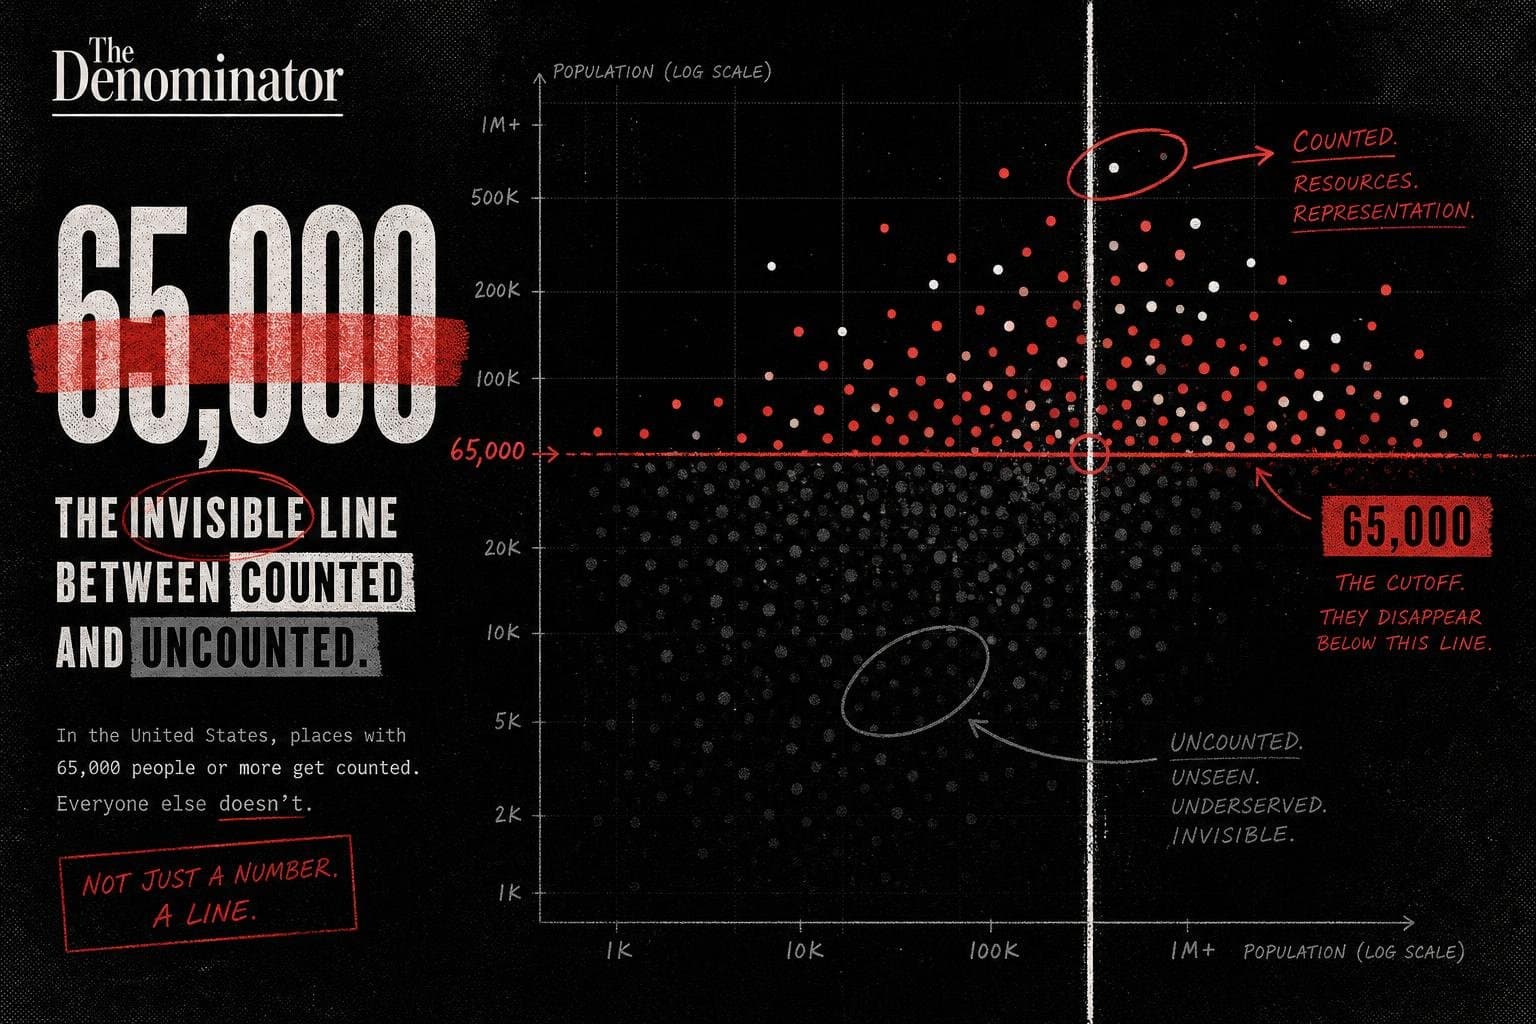

Here's a number that never makes it into the press release: 65,000. That's the population threshold the Census Bureau uses to decide which places get a 1-year estimate from the American Community Survey and which places simply don't exist in that dataset. The Bureau confirmed this week that the 2025 ACS 1-year estimates and Supplemental Estimates are scheduled for release Oct. 29, with data covering states, D.C., Puerto Rico, congressional districts, and metro areas that clear the Bureau's publication thresholds.
Those thresholds are the quiet mechanism worth understanding before the headlines about income, health insurance, or commuting times start circulating in three weeks.
The Threshold Is the Denominator Problem, Just Moved Upstream
The ACS 1-year estimates require a geography to have a population of 65,000 or more. The 1-year Supplemental Estimates — a lighter-touch product meant to extend coverage — drop that bar to 20,000, per the Bureau's own release. Anything smaller gets folded into the 5-year estimates instead, a different product built from pooled survey responses across half a decade.
This isn't a conspiracy. It's sample-size math, the same discipline that governs every monthly release out of the Bureau of Labor Statistics — a different federal statistical agency, but one that applies the identical logic when it publishes its own price and labor data on a fixed release calendar. The Bureau is making the same call this newsletter makes every week: don't report a number precise to a decimal point when the underlying sample can't support that precision.
But the effect is uneven by design. A fast-growing suburb of 70,000 gets an annual read on its labor force, housing costs, and health coverage. A town of 40,000 a few miles away gets a number that's already aged up to five years old by the time it's published. When commentators compare "the latest Census data" across two nearby places, they are frequently comparing a current snapshot to a half-decade blend without saying so.
Trust in the Number Depends on Trust in the Agency Behind It
It's worth remembering that the credibility of any federal dataset rests on the institutional independence of the agency producing it. Reporting this month on the Cybersecurity and Infrastructure Security Agency found political appointees pressing career staff toward actions that alarmed the people responsible for securing election systems, according to ProPublica. That's a different agency and a different kind of data entirely, but the underlying lesson transfers: statistical output is only as reliable as the independence of the process that generates it, and readers are right to ask who controls methodology before they trust a release.
Misinformation about official claims doesn't wait for methodology questions, either. Reuters fact-checkers have spent the past two weeks knocking down fabricated claims attributed to public figures and institutions — recycled videos mislabeled as current events, invented policy proposals attributed to a candidate who never made them, according to Reuters Fact Check. None of that touches the ACS directly, but it's the same environment a new data release drops into: a public already primed to accept confident-sounding numbers without checking where they came from.
What's Actually New This Cycle
Two webinars bracket the release. The Bureau held one on Oct. 15 covering content changes to the 2025 survey — additions and modifications touching sewer service, electric vehicles, household roster questions, educational attainment, health insurance coverage, and labor force items, per the Census announcement. A second webinar, scheduled for Thursday, Oct. 22, will walk through how to pull the data once it's live.
Embargo subscribers get early access from Oct. 27 at 10 a.m. ET; the public dataset goes live at 12:01 a.m. on Oct. 29, per the Bureau's tip sheet published Oct. 16. That same tip sheet notes the Bureau is also preparing an Educational Attainment table package and new international population projections running through 2100 — both tentatively dated for late October.
I wrote in August about how the ACS 1-year estimates had slipped behind schedule and what that delay meant for anyone trying to make a timely local decision. This cycle looks back on track, at least on paper — the dates are set, the webinars are scheduled, the embargo window is defined. That's worth noting on its own, because a data release landing on time is not something this beat gets to say often.
What to Watch For on Oct. 29
When the numbers land, the instinct will be to grab the headline figure for whatever metro area a story needs — median income, uninsured rate, commute time — and run it. Before you do, check two things: whether the geography clears the 65,000-population floor for a true 1-year figure, and whether a given comparison is being made against last year's 1-year estimate or a 5-year blend from a different release. Those two numbers measure different things, even when they share a decimal point.
The content changes to the 2025 survey — new questions on electric vehicles and household composition — mean some comparisons to prior years won't be apples to apples either. That's not a flaw in the survey. It's a reason to read the methodology notes before the chart.


