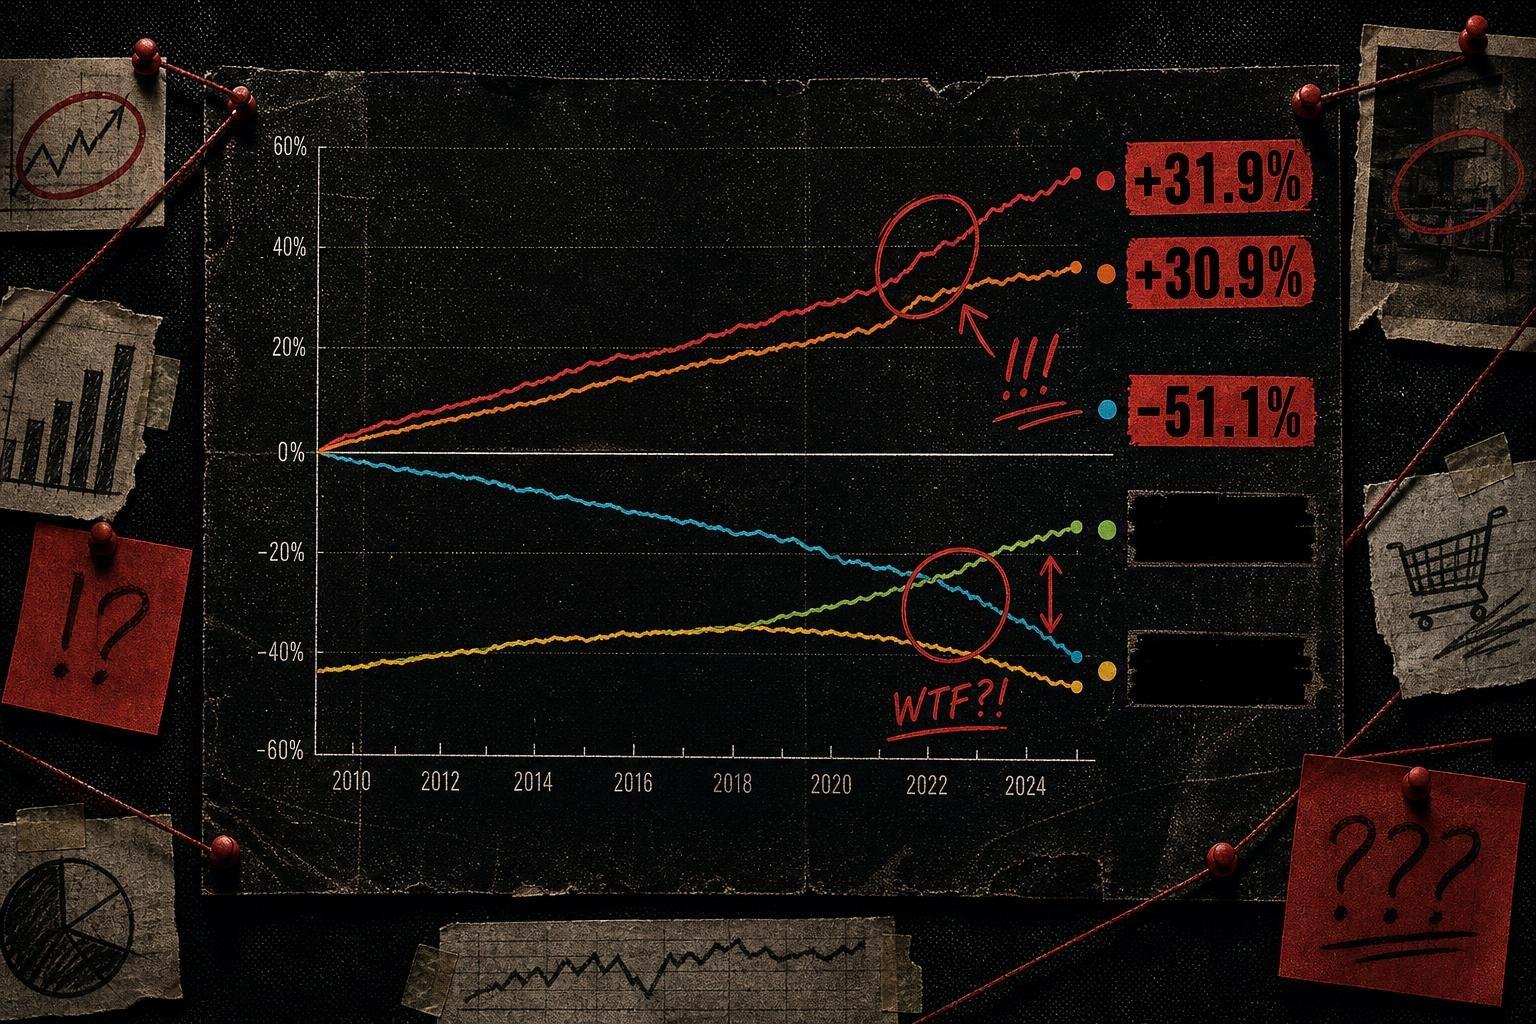

Here's a number that should stop you mid-scroll: consumer prices in the United States rose 22.0% over the five years ending October 2026, according to the Bureau of Labor Statistics. That's not a monthly print. That's not even an annual one. That's BLS doing something it doesn't do often — publishing a five-year cumulative number instead of its usual 12-month comparison.
Why would a statistical agency suddenly change its favorite window? Because the window is the whole story. A single year of CPI tells you almost nothing about how a household's budget has actually moved. Five years tells you something closer to the truth, and in this case the truth has a lot of variance hiding inside it.
The Average Hides a Civil War Between Categories
Start with the headline 22.0% and then look at what's underneath it, because the BLS release breaks the five-year window into categories, and the spread is the real finding. Smartphones fell 51.2% over those five years. Communication overall fell 3.7%. Meanwhile fuels and utilities rose 30.9%, gasoline rose 31.9%, and public transportation rose 39.9% — all over the same five years ending October 2026.
That's not noise. That's two different economies living inside one index. If you bought a phone in the last five years, inflation handed you a discount. If you commute by bus or heat your house with gas, inflation hit you for a third more than the headline suggests. "All items up 22%" is an average of a deflationary category and a near-40% increase sitting next to each other, and the average is true for approximately nobody's actual spending pattern. This is the oldest trick in the CPI deck and it still works because headlines need one number and reality insists on having twelve.
I'd call this a reasonably well-constructed release, for what it's worth — BLS shows its category breakdown in the same table as the topline, which is more than most outlets reporting the 22% figure will bother to show you. The methodology problem isn't BLS's. It's what gets copied into the next paragraph of coverage.
Real Household Income Just Went Negative — While GDP Kept Climbing
Now pair that with a second release that landed the same week: the OECD's growth and economic well-being report for the second quarter of 2026. Real household income per capita in the United States contracted by 0.1% in Q2 2026, after several quarters of growth. Real GDP per capita over the same quarter grew by 0.5%.
Sit with that divergence for a second, because it's the heart of why "the economy is growing" and "households are falling behind" can both be true in the same quarter without anyone lying. GDP per capita measures aggregate economic output. Household income per capita measures what households actually have available to spend or save. They track together most of the time — that's why people conflate them — but they're not the same series, and this quarter they split.
The OECD data show this wasn't just a US story. Across the 20 countries it tracks with available data, 12 recorded real household income growth in Q2 2026 while 8 recorded contraction. Italy's household income fell 1.0% in Q2 2026 after expanding 0.4% the prior quarter, which the OECD attributes to inflation reaching 1.4% alongside reduced social benefits — note that's the OECD's own stated driver, not a causal claim I'm making independently. France's household income and GDP per capita both contracted, by 0.6% and 0.1% respectively, after both had already fallen the previous quarter. Canada went the other direction entirely: household income rose 1.5% in Q2 2026, driven by wage gains in finance and real estate plus a one-off government payment to offset grocery costs, while GDP per capita rose 1.0%.
None of this means GDP growth causes income decline, or that stronger GDP numbers are "fake" — they're measuring different things by design. But it does mean that when a government or a headline writer leans on GDP per capita to describe how households are doing, they're borrowing authority from a number that isn't built to answer that question.
The Denominator Is Also Changing Shape Underneath You
There's a third layer here that almost nobody puts next to the first two, and it matters for both. The Census Bureau's new estimates on families and living arrangements, released November 17, 2026, show that one-person households made up 30% of all U.S. households in 2026, up from 21% in 1976. The median age at first marriage climbed to 30.5 for men and 28.6 for women in 2026, up from 23.8 and 21.3 in 1976. The share of families with children under 18 in the household dropped from 54% to 38% over the same five decades.
Why does this belong in a conversation about inflation and household income? Because "household income per capita" and "per-household" inflation exposure both depend on what a household is, and that unit has been quietly shrinking and aging for fifty years. A one-person household absorbing a 31.9% five-year rise in gasoline prices faces a different arithmetic than a two-earner household with kids splitting the same cost increase three or four ways. When you compare household-level economic statistics across even a few years, let alone across the 1976-to-2026 window Census uses, you're not holding the denominator still. The Census Bureau notes its comparisons are tested for statistical significance at the 10% level — a methodological disclosure that most outlets citing these figures skip entirely, which is itself worth flagging.
This is the same failure mode as the smartphone-versus-gasoline split inside CPI, just operating one level up. Average household income growth assumes an average household. There isn't one. There's a 30% slice living alone, a shrinking share raising kids, and a growing share over 65 — nearly 31% of householders in 2026, up from 20% five decades ago — and each of those slices experiences the same topline inflation and income numbers completely differently.
What a Good Dataset Looks Like, and What to Watch Next
Credit where it's due: BLS choosing to publish the 5-year cumulative view voluntarily, with the category table attached, is the agency doing its job well. It's handing readers the denominator instead of making them dig for it. The OECD's quarterly release does something similar — it explicitly distinguishes GDP per capita from household income per capita in its own text, rather than letting readers assume they're interchangeable. Good statistical communication looks like this: show the breakdown before someone asks for it.
The failure, when it happens, is downstream — in whichever outlet picks one number from either release and drops the rest of the table. Watch for how the next round of US economic coverage handles Q3 2026 household income data when the OECD updates its series, likely in late February 2027 on its usual quarterly schedule. If GDP per capita keeps climbing while household income per capita stays flat or negative, that's not a one-quarter blip anymore — it's a pattern, and it'll deserve a sharper headline than either number gets on its own. Also worth tracking: the OECD's own November 2026 statement on reinforcing statistical safeguards as AI reshapes data production — a signal that even the agencies producing these numbers are worried about how easily the context around them gets stripped out before it reaches you.
The honest version of this week's economic news isn't "prices are up 22%" or "the economy grew" or "families have changed." It's that three true numbers, read separately, lie to you by omission, and read together, start to explain each other.


