When the monthly jobs report landed last August, President Trump didn't dispute the methodology. He didn't point to a sampling error or question the household survey's coverage rate. He posted that the numbers were "RIGGED" and, shortly after, fired BLS Commissioner Erika McEntarfer. No evidence was cited. No alternative figure was offered. The attack wasn't statistical — it was institutional.
That's the tell. When someone claims a number is fabricated rather than arguing it's miscounted, they're not doing data criticism. They're doing something else entirely. And the distinction matters enormously, because the BLS isn't just a producer of statistics — it's the shared denominator that makes almost every other economic argument possible. Destroy confidence in the denominator, and every fraction becomes negotiable.
The BLS Doesn't Produce One Number. It Produces the Infrastructure for All Numbers.
Most people encounter the BLS through two data points: the unemployment rate and the inflation figure. Both appear in headlines the first Friday of each month, both move markets, and both get weaponized in political arguments. But treating those as the BLS's output is like describing a hospital as a place that produces discharge summaries.
The monthly jobs report alone draws on two separate surveys: a payroll survey reaching over 120,000 businesses and government agencies, and a household survey sampling roughly 60,000 households nationwide. The headline unemployment rate — U-3 — counts workers actively seeking employment. The broader U-6 measure adds discouraged workers who've stopped looking and part-timers who want full-time work. U-6 is always higher. It shows more of the labor market's slack. Politicians who cite U-3 when it's favorable and U-6 when it isn't are doing exactly the kind of denominator-switching this publication exists to flag — but at least both numbers come from a methodology you can read, a sample size you can evaluate, and a history you can compare against.
That comparability is the point. The BLS has been producing labor statistics since Congress created it in 1884, initially to track wages and working conditions as the economy shifted from agriculture to industry. Over more than a century, the methodology has been refined, documented, and made consistent enough that a 2026 unemployment figure can be meaningfully compared to a 1994 one. That's not a small thing. It's the entire foundation of trend analysis. "Up 30% since when?" is only answerable if someone kept the records.
The Specific Threat Isn't Fabrication. It's Degradation.
Here's what former officials are actually worried about, and it's more subtle than Trump simply ordering the BLS to publish false numbers. According to reporting via SAN, the BLS has already absorbed deep budget and staff cuts, and is now preparing for a leadership change after months of institutional disruption. Former officials and economists have pledged to "watch like hawks" for political manipulation — but the thing they're watching for isn't necessarily a number that's obviously wrong. It's a number that's subtly less right.
Statistical degradation is harder to detect than fabrication, and that's precisely what makes it dangerous. Consider the mechanisms:
Sample attrition. The payroll survey reaches 120,000+ businesses monthly. Budget cuts reduce field staff. Fewer follow-up calls get made. Response rates fall. The sample shrinks or skews toward larger, easier-to-reach employers. The headline number still comes out on the first Friday of the month. It just represents a narrower slice of the economy than it used to — and the methodology footnotes, which almost no one reads, quietly note the change.
Seasonal adjustment drift. BLS figures are seasonally adjusted using models that require years of historical data and regular recalibration. If the recalibration is deprioritized — because the statisticians who do it were laid off, or because the budget for the underlying data collection was cut — the adjustments become stale. Numbers that look comparable across years aren't, quite. The error is invisible unless you're deep enough in the methodology to notice.
Definitional creep. The BLS has historically been transparent about its measurement choices — publishing U-3 alongside U-6, for instance, so users can see what's included and excluded. Political pressure doesn't need to change the number; it just needs to change which number gets emphasized, or which footnotes get buried. The data stays technically accurate. The story it tells gets managed.
None of these are hypothetical. They're the standard toolkit of institutional data manipulation in democracies that still maintain the form of independent statistics while hollowing out the substance. The former officials pledging to watch aren't being paranoid. They're describing a well-documented pattern.
Why "Rigged" Is a More Effective Attack Than "Wrong"
This is the part that should concern anyone who cares about public numeracy, regardless of political affiliation.
If Trump had said "the BLS undercounts gig workers in its household survey, and here's the methodology gap," that would be a falsifiable claim. You could check it. Researchers have actually made versions of this argument — the rise of platform-based work does create genuine measurement challenges for surveys designed in an earlier labor market. A methodological critique invites a methodological response. The number either holds up or it doesn't.
"Rigged" does something different. It's not a claim about the denominator — it's a claim that the denominator itself is an act of bad faith. And once that's established in enough people's minds, no subsequent number can dislodge it. A good jobs report becomes evidence of the rigging. A bad one becomes proof the rigging failed. The claim is unfalsifiable by design.
This is the statistical version of what epidemiologists call an "unfalsifiable narrative" — the kind of misinformation infrastructure described by researchers tracking health misinformation, where the conspiracy framework is constructed so that confirming evidence confirms it and disconfirming evidence confirms it too. The hantavirus outbreak that emerged from a cruise ship earlier this year followed the same playbook: before public health agencies had released detailed guidance, social media accounts were already claiming the outbreak was caused by COVID vaccines, that ivermectin would treat it (it won't — there is no specific antiviral for hantavirus), and that the whole thing was a pharmaceutical scheme. The actual epidemiology — eight cases linked to the MV Hondius, three fatalities, the Andes strain being the only hantavirus known to spread person-to-person — became almost irrelevant to the online conversation. The framework had already been installed.
The BLS attack works the same way. The goal isn't to win a statistical argument. It's to make statistical arguments feel pointless.
What Good Denominator Defense Actually Looks Like
The former officials watching for manipulation are doing the right thing, but watching isn't sufficient. The more durable defense is methodological transparency — making the BLS's work legible enough that degradation becomes visible before it becomes entrenched.
A few concrete things that matter:
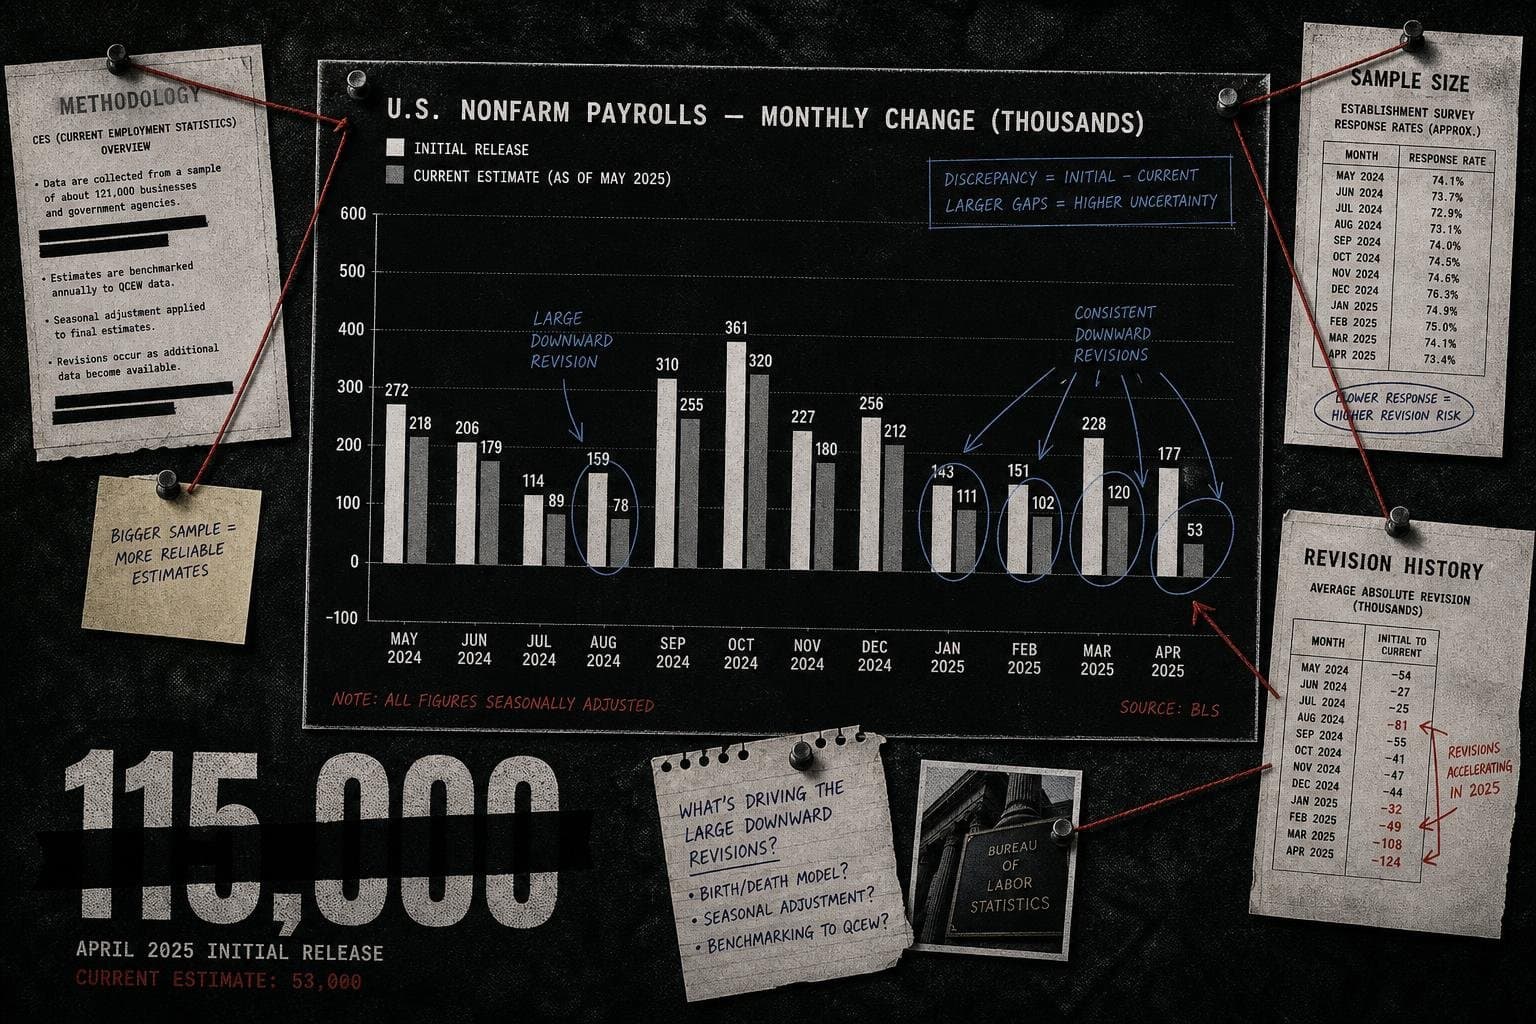
Response rate disclosure. If the payroll survey's response rate drops from its historical baseline, that should be reported prominently alongside the headline number — not buried in technical notes. A number derived from 80,000 responses means something different than one derived from 120,000, even if the methodology is otherwise identical.
Vintage tracking. The BLS regularly revises its figures as more complete data comes in. Those revisions are informative — large, systematic revisions in one direction suggest the initial estimates were biased. Tracking revision patterns over time is one of the cleanest ways to detect whether the initial estimates are being managed.
Independent replication. The Federal Reserve, the Congressional Budget Office, and academic economists all produce their own labor market estimates using different methodologies. When those estimates diverge from BLS figures by more than historical norms, that divergence is itself a signal worth investigating. The BLS doesn't have to be the only source; it has to be a source that can be checked.
None of this is exotic. It's the same "compared to what?" discipline that applies to any statistical claim. The BLS's April figure — 115,000 jobs added, annual inflation at 3.8%, average hourly wages at $37.41 — is meaningful only in relation to prior months, prior years, and the methodology used to produce it. Strip any of those reference points away and you're left with a number that can mean anything.
The Denominator You Can't Replace
There's a version of this story where the BLS gets sufficiently degraded, public trust collapses, and we end up in a world where every economic argument is conducted with private data — employer surveys, credit card transaction data, satellite imagery of parking lots. Some of this data is genuinely useful. Researchers already use it to cross-check official statistics.
But private data sources have their own selection biases, their own methodological choices, and — crucially — their own incentives. A credit card transaction dataset tells you about people who use credit cards. A payroll processor's data tells you about firms that use that processor. None of them have been collecting consistent, documented, publicly auditable data since 1884. None of them are legally required to publish their methodology. None of them are subject to the same congressional oversight.
The BLS's value isn't just the numbers it produces. It's the fact that those numbers come with a documented denominator — a sample size, a methodology, a revision history, a comparison year. That's what makes the numbers arguable in the productive sense: you can dispute them, refine them, contextualize them. You can ask "compared to what?" and get an answer.
Destroy the institution that maintains the denominator, and you don't get better numbers. You get a world where every number is someone's number, and the only question is whose you trust. That's not a data environment. That's a power environment. And in a power environment, the people with the most power set the baseline.
Watch the revision patterns. Watch the response rates. Watch the methodology footnotes. The attack on the BLS isn't coming as a single dramatic fabrication. It's coming as a slow erosion of the infrastructure that makes the numbers mean anything at all.


