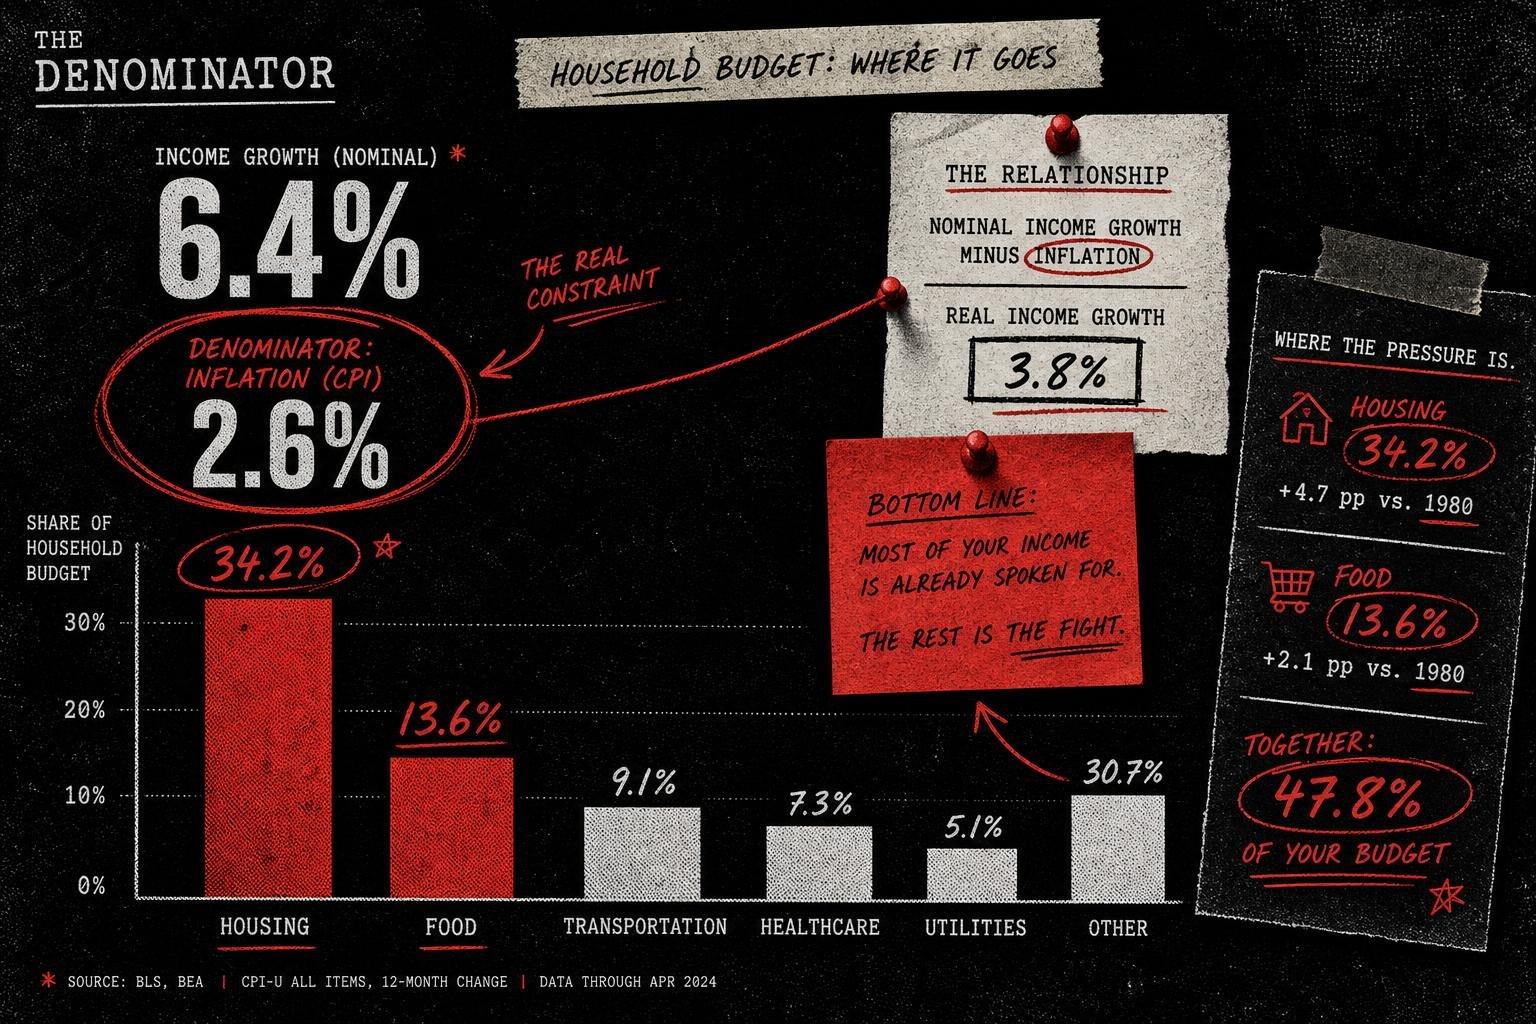

Every year the Bureau of Labor Statistics quietly drops a dataset that deserves more attention than the headline inflation print gets, and every year it gets ignored in favor of whatever CPI number moved the market that morning. On October 29, BLS released its 2025 Consumer Expenditure Survey, and the top line looks terrific: average household income before taxes rose 6.4% from 2024 to 2025, reaching $110,847. Average annual expenditures rose 4.3%, to $81,905. If you stopped reading there, you'd conclude American households had a great year.
You shouldn't stop there. The same release tells you the Consumer Price Index for All Urban Consumers rose 2.6% over that period. That's the denominator the 6.4% and 4.3% figures need to be read against. Income outpaced inflation by roughly 3.8 percentage points; spending outpaced it by about 1.7 points. Both are real gains — genuinely good news — but they're a fraction of the size the raw percentages suggest, and nobody reporting "incomes up 6.4%" bothered to mention that a third of it evaporates against the price level.
Why the Housing and Food Lines Are the Real Story
Buried in the BLS release is the breakdown that tells you where the 4.3% expenditure increase actually went. Housing spending rose 5.8%, driven by an 8.0% jump in shelter costs alone, and now eats 33.9% of the average household budget — more than transportation, food, healthcare and entertainment combined get close to matching. Food spending rose 4.6%, with meat, poultry, fish and egg costs up 11.7% on their own.
This is the pattern that gets lost when people compare top-line expenditure growth to top-line income growth and call it a wash. The composition matters. A household whose spending growth is concentrated in shelter and groceries — categories with limited substitution options — is in a structurally different position than one whose spending grew because it bought more vacations. The BLS table doesn't editorialize about that distinction. It just hands you the numbers and lets you do the arithmetic, which is exactly what a Consumer Expenditure Survey — a household-level survey instrument, not an administrative tax record — is built for. The tradeoff is that it carries normal survey uncertainty around smaller subcategories, which is one reason BLS flags which year-over-year changes are "statistically significant" rather than treating every percentage move as meaningful. Food and housing made that cut. Not every line item did.
Meanwhile, the Denominator Is Moving Again — Just Not the One in That Report
Here's where a lot of commentary goes sideways: the BLS release measures the 2024-to-2025 annual average. It is not a live read on where inflation stands right now. For that, you want the separate, more current release the OECD published the same week, on November 6: year-on-year OECD headline inflation rose to 4.5% in September 2026, up from 4.3% in August — a different measure, a different window, and a different geography (OECD-wide, not strictly the U.S.) than the BLS annual-average figure above. Treating these as the same number, or chaining them together into a single trend line, is exactly the kind of denominator sloppiness this newsletter exists to flag. They're not interchangeable, and conflating them would be a worse error than either report makes on its own.
What the OECD release does well — and this is worth naming, because good statistical practice deserves credit when it shows up — is state its base year explicitly. The report notes that average prices across the OECD are now more than 40% above their December 2019 level, before the pandemic started distorting price data, and that food prices are almost 50% higher and energy prices nearly 70% higher over that same multi-year window. That's a denominator doing its job: instead of letting a reader infer "prices are stabilizing" from a month-over-month deceleration, the OECD anchors the comparison to a fixed pre-pandemic baseline so the cumulative scale is visible. Energy is the driver of the September acceleration specifically — up 17.4% year-on-year, rising in 31 of the 37 OECD countries with available data, versus 13.6% in August — while core inflation, which strips out food and energy, stayed comparatively steady at 3.7%. That's an important split. Headline and core are telling two different stories this month, and only one of them is about an underlying price trend rather than an energy-market shock.
The Fabricated Version of This Problem Is Worse — and Circulating Right Now
If understated denominators are the subtle failure mode, fabricated ones are the blunt-force version, and Reuters caught a clean example of it this week. Fact-checkers there debunked a pair of circulating Tesco receipts purporting to show how UK food prices have changed since 1990 — receipts that were simply invented, not transcribed from any real till record. The mechanism is instructive regardless of country: pick a flattering historical year, pair it with a fabricated or cherry-picked current figure, and let the multiplication do the persuading. Nobody checks the receipt. They just share the percentage.
The same Reuters fact-check queue flagged a cluster of midterm-adjacent claims built on the identical structural trick — misleading comparisons stripped of context, old footage re-dated, numbers presented without a verifiable source behind them. The throughline across all of them isn't partisan. It's that a number with no stated origin, no stated base period, and no stated sample is not a fact. It's a prop.
What "Compared to What" Actually Buys You Here
Put the three releases side by side and a cleaner picture emerges than any single headline offers. U.S. households, on average, gained real ground in 2025 — income growth of 6.4% against 2.6% inflation is a genuine improvement, even after you account for the fact that gains were not evenly distributed across income quintiles, with the BLS data showing average expenditures ranging from $37,935 in the lowest quintile to $159,512 in the highest. At the same time, the most current cross-national read says inflation is reaccelerating, not fading, with energy doing most of the damage and core inflation holding closer to steady. Those two things can both be true without contradicting each other, because they're measuring different time windows on different geographies. The mistake would be flattening them into one sentence — "inflation is cooling, households are gaining ground" — when the freshest data point actually says the opposite about the direction of travel.
None of this requires a model. It requires reading the two numbers in the same release instead of just the one that made the press release headline, and it requires resisting the urge to stitch together reports that weren't measuring the same thing.
What to Watch Next
The next BLS Consumer Price Index release will show whether the U.S., like the OECD aggregate, saw an energy-driven acceleration in October — a genuine test of whether the 2.6% annual figure in this week's expenditure report is about to look dated. On the international side, the OECD's own release already points ahead: Eurostat's flash estimate has euro-area inflation rising further, to 4.0% for October, with energy inflation estimated at 20.8%. If that flash estimate holds when final data lands, the "energy did it" story gets a second data point instead of just one noisy month — and that's the difference between a trend and a blip, which is the entire point of asking for the time window before you believe the percentage.


