A number is circulating in policy discussions that sounds alarming: autism diagnoses in children have risen by 6% to 10% annually across OECD countries over the past decade. The instinct is to read that as an epidemic curve. A new OECD report says that instinct is wrong — and the distinction matters enormously for how governments respond.
The Number Is Real. The Interpretation Is Broken.
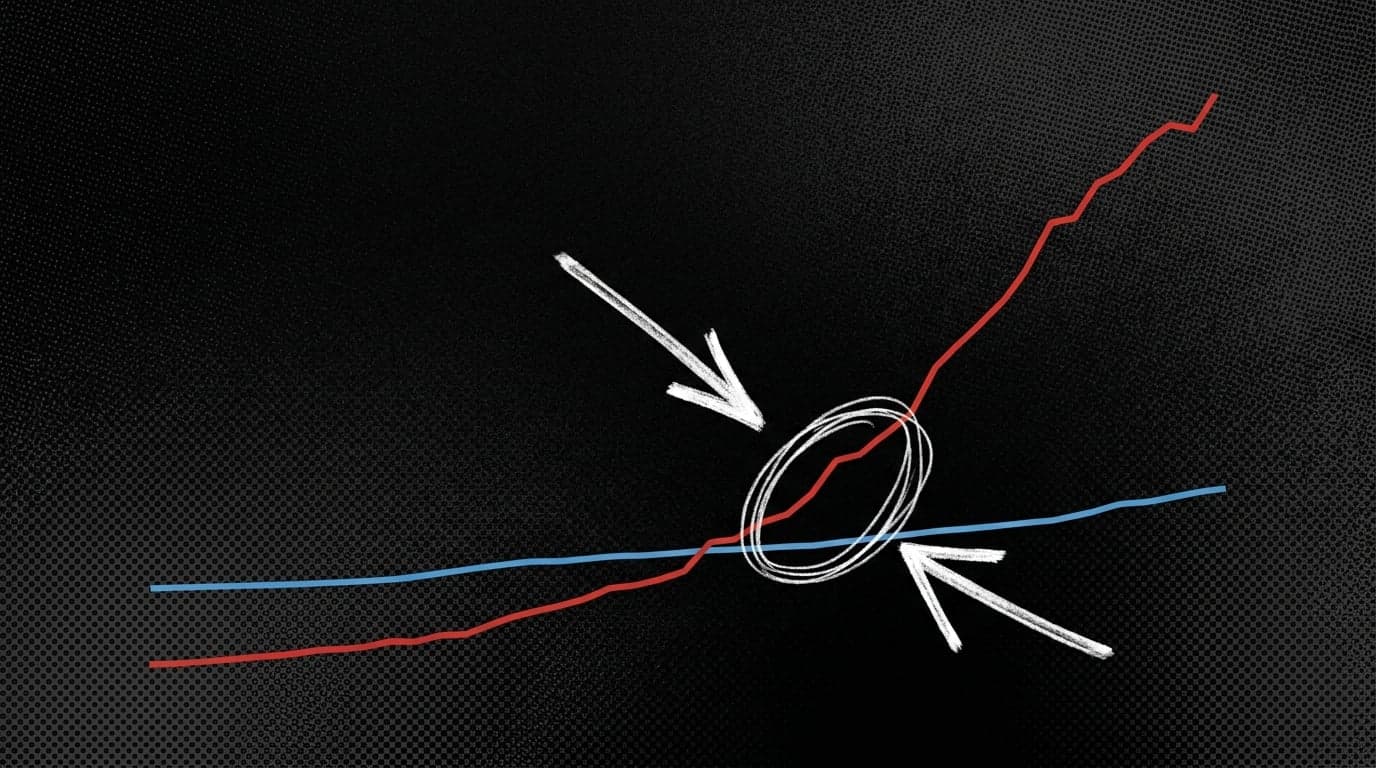
The OECD's analysis is direct: autism itself is not necessarily becoming more common. What's changing is the measurement apparatus. Three things shifted simultaneously:
- Diagnostic criteria broadened. Conditions previously treated as separate were consolidated under a single "spectrum" label. The same child, same neurology, different decade — different diagnosis.
- Detection moved earlier. Children are now being assessed from around age two. Earlier detection means more cumulative diagnoses per cohort, even if prevalence is flat.
- Stigma declined, awareness rose. Parents, teachers, and clinicians are more likely to seek and offer assessment. The referral pipeline widened.
Each of these factors inflates the diagnosis count without requiring a single additional case of autism in the underlying population. The 6–10% annual increase is a measurement trend, not necessarily a disease trend. Conflating the two is a classic denominator error: the denominator (children with autism) didn't necessarily grow; the numerator (children diagnosed with autism) did, because the detection net got bigger.
Why This Framing Error Has Consequences
When a rising diagnosis count gets read as a rising disease burden, the policy response points in the wrong direction. You fund research into causes of an epidemic rather than capacity for an expanded diagnostic system. The OECD report identifies exactly this gap: waiting times are long and specialist shortages are widespread, and families who can't afford private providers face delays that affect their children's access to early intervention.
The supply problem isn't mysterious. If you expand the diagnostic criteria and lower the referral threshold, volume goes up. If you don't expand the specialist workforce at the same rate, queues form. That's arithmetic, not epidemiology. It's the same structural dynamic the Census Bureau's Business Trends and Outlook Survey captures in employer contexts — when demand for a service expands faster than the workforce supplying it, backlogs are the predictable result, not a surprise.
The Access Gap Is Where the Real Inequality Lives
The OECD data surfaces a pattern that deserves its own headline:
- Girls are still underdiagnosed relative to boys, because their presentations differ and are harder to recognize under criteria developed primarily from male samples.
- Children from disadvantaged or minority communities face compounding barriers — limited awareness, difficulty navigating healthcare systems, and reduced access to private providers when public queues are too long.
- Private-pay families move faster. When public systems are overwhelmed, the diagnosis timeline becomes a function of income. Early intervention — which the OECD identifies as genuinely effective for communication, social, and learning development — becomes a class-stratified resource.
This kind of access inequality is not unique to autism. The WHO's framework for chronic disease burden) consistently finds that disadvantaged populations face compounding barriers — from limited awareness to difficulty navigating healthcare systems — regardless of the condition in question. The pattern is structural, not incidental.
So the "diagnosis surge" story has two layers. Layer one: more children are being identified, which is largely good. Layer two: the system built to support those children hasn't scaled, and the shortfall falls hardest on the kids who were already least likely to be seen.
Three Questions the Headline Number Doesn't Answer
Before citing the 6–10% annual increase figure, ask:
- Compared to what baseline? Annual increases relative to a decade ago include the full effect of broadened diagnostic criteria. The trend line starts from a measurement floor, not a biological one.
- Diagnosed where? OECD countries vary significantly in their support approaches, waiting times, and specialist availability. An aggregate rate papers over enormous cross-country variance.
- Diagnosed by whom? If private providers are absorbing overflow from strained public systems, the diagnosis rate is partly a function of who can pay — which means the "rise" is also a wealth effect.
The OECD report is careful not to claim the underlying prevalence is stable — it says "not necessarily" more common, which is the honest hedge. What it does establish is that the measurement system changed faster than the support system. That's the policy problem. The epidemic framing is a distraction from it.
Watch for the OECD's country-level breakdowns on specialist workforce capacity — that's where the actionable gap will show up most clearly.


