
The headline from Friday's employment report is tidy: the unemployment rate held at 4.1% in August 2026, same as July. Markets exhaled. Commentators called it stable. And technically, they're right — the topline number didn't move.
But the BLS household data table is a more interesting document than the headline suggests, and one number buried in the duration-of-unemployment rows has been doing something worth paying attention to.
The Stable Headline Is Hiding a Compositional Shift
Start with what "stable" actually means here. The August employment situation release shows 7,031,000 unemployed people in August, up 115,000 from July's 6,916,000. The unemployment rate rounds to 4.1% in both months because the labor force also expanded — 683,000 more people entered or re-entered the labor force in August, pushing the participation rate up 0.2 points to 61.6%.
So the rate held flat not because unemployment got better, but because more people showed up to look for work at the same time more people became unemployed. That's a different story than "stable." It's a story about two things moving in opposite directions and canceling each other out in the headline figure.
This is the denominator problem in its most literal form: the rate is a fraction, and both the numerator and denominator changed. Reporting only the fraction erases that information entirely. It's the same structural issue this publication flagged in the June CPI coverage — a single summary statistic that looks clean precisely because the messiness has been divided away.
The Long-Term Number Is the One That Should Worry You
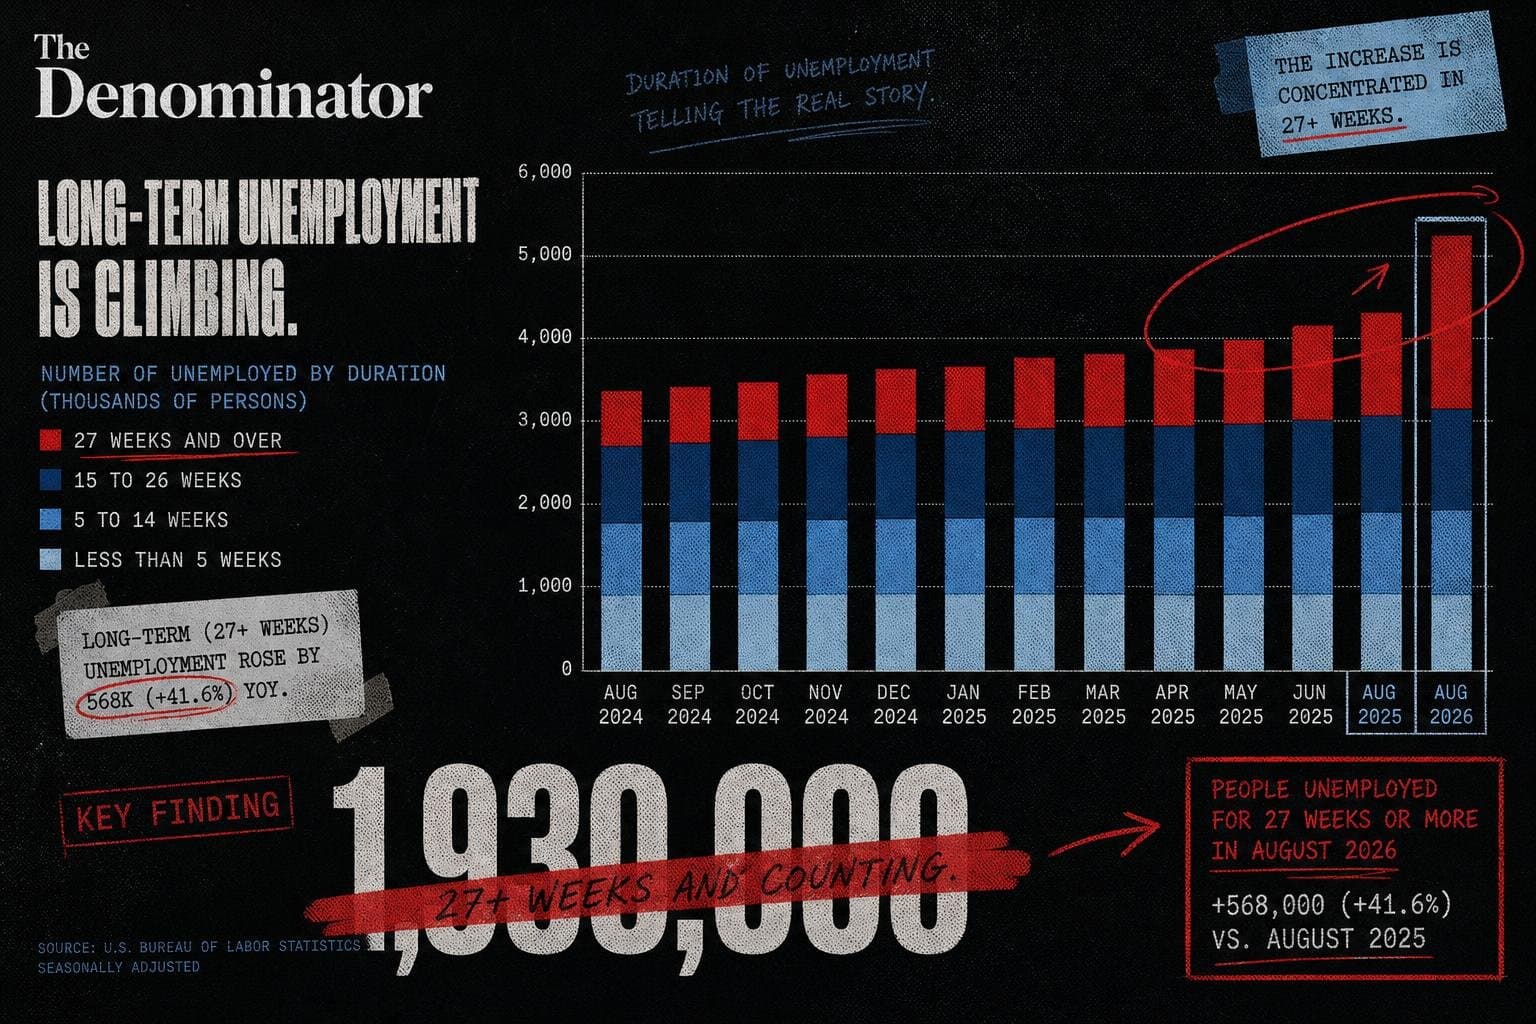
Here's the figure that caught my attention: workers unemployed for 27 weeks or longer — the standard definition of long-term unemployment — came in at 1,930,000 in August, up 159,000 from July's 1,771,000.
To put that in context: long-term unemployment had been running at 1,924,000 in August 2025, then dipped through the spring and early summer of 2026, reaching 1,771,000 in July. August reversed that progress almost entirely, returning to nearly the same level as a year ago. One month doesn't make a trend, and the BLS data doesn't tell us why — whether this is seasonal, structural, or noise in the survey. But a 159,000 single-month jump in the 27-weeks-and-over category is not a rounding error.
Long-term unemployment matters differently than short-term unemployment. Workers out for more than six months face compounding disadvantages: skills atrophy, employer screening effects, and network erosion. The Census Bureau's economic indicators track the broader conditions that shape who ends up in that category — housing costs, trade flows, regional demand — and the June trade data showed imports and exports both contracting, which tends to show up in labor markets with a lag. The short-term unemployed (under 5 weeks) actually fell slightly in August, to 2,000,000 from 1,960,000 — a negligible change. The churn at the short end of the duration distribution looks relatively healthy. The accumulation at the long end does not.
The Demographic Splits Are Doing Something Unusual
The August data also shows some demographic movements that cut against the simple "stable" narrative.
Teenage unemployment (ages 16–19) jumped to 14.1% in August from 12.1% in July — a 2.0 percentage point swing in a single month, affecting a base of several hundred thousand workers. Some of this is almost certainly seasonal: August is when summer jobs end and back-to-school transitions happen. But the August 2025 figure was 13.9%, so this year's reading is slightly elevated relative to the same month last year.
Meanwhile, unemployment among workers without a high school diploma fell sharply — from 5.4% in July to 4.7% in August, a 0.7 point drop. That's a meaningful move in a group that typically faces the most cyclical exposure. At the same time, workers with some college or an associate degree ticked up 0.1 points to 3.7%, while workers with a bachelor's degree or higher held flat at 2.7% for the fourth consecutive month.
The pattern that emerges — if you're willing to read a pattern into a single month's data, which you should do cautiously — is a labor market that's bifurcating at the duration dimension more than the credential dimension. The credential gaps are relatively compressed by historical standards. The duration gap is widening. That distinction matters for how you think about policy responses: credential-based gaps call for training programs; duration-based gaps call for something closer to what WHO governance researchers describe as structural barriers in a different context — accumulated disadvantage that compounds the longer institutions fail to intervene.
What the Headline Rate Cannot Tell You
The 4.1% unemployment rate is a real number. It's not wrong. But it's a snapshot of a stock — how many people are unemployed right now as a share of the labor force — and it tells you almost nothing about the flows underneath it: who's becoming unemployed, how long they're staying that way, and whether the composition of unemployment is shifting in ways that matter for policy.
The August data suggests the flows are worth watching. The long-term unemployed count is back near its year-ago level after a summer of improvement. The labor force expanded, which is genuinely good news, but it also mechanically suppressed the headline rate. And the teenage unemployment spike, while likely seasonal, is the kind of number that disappears into a rounding operation when you report only the aggregate.
The September release — covering August payrolls and the first look at September household data — drops in early October. The number to watch won't be the unemployment rate. It'll be whether that 27-weeks-and-over figure holds at 1,930,000 or keeps climbing.


