


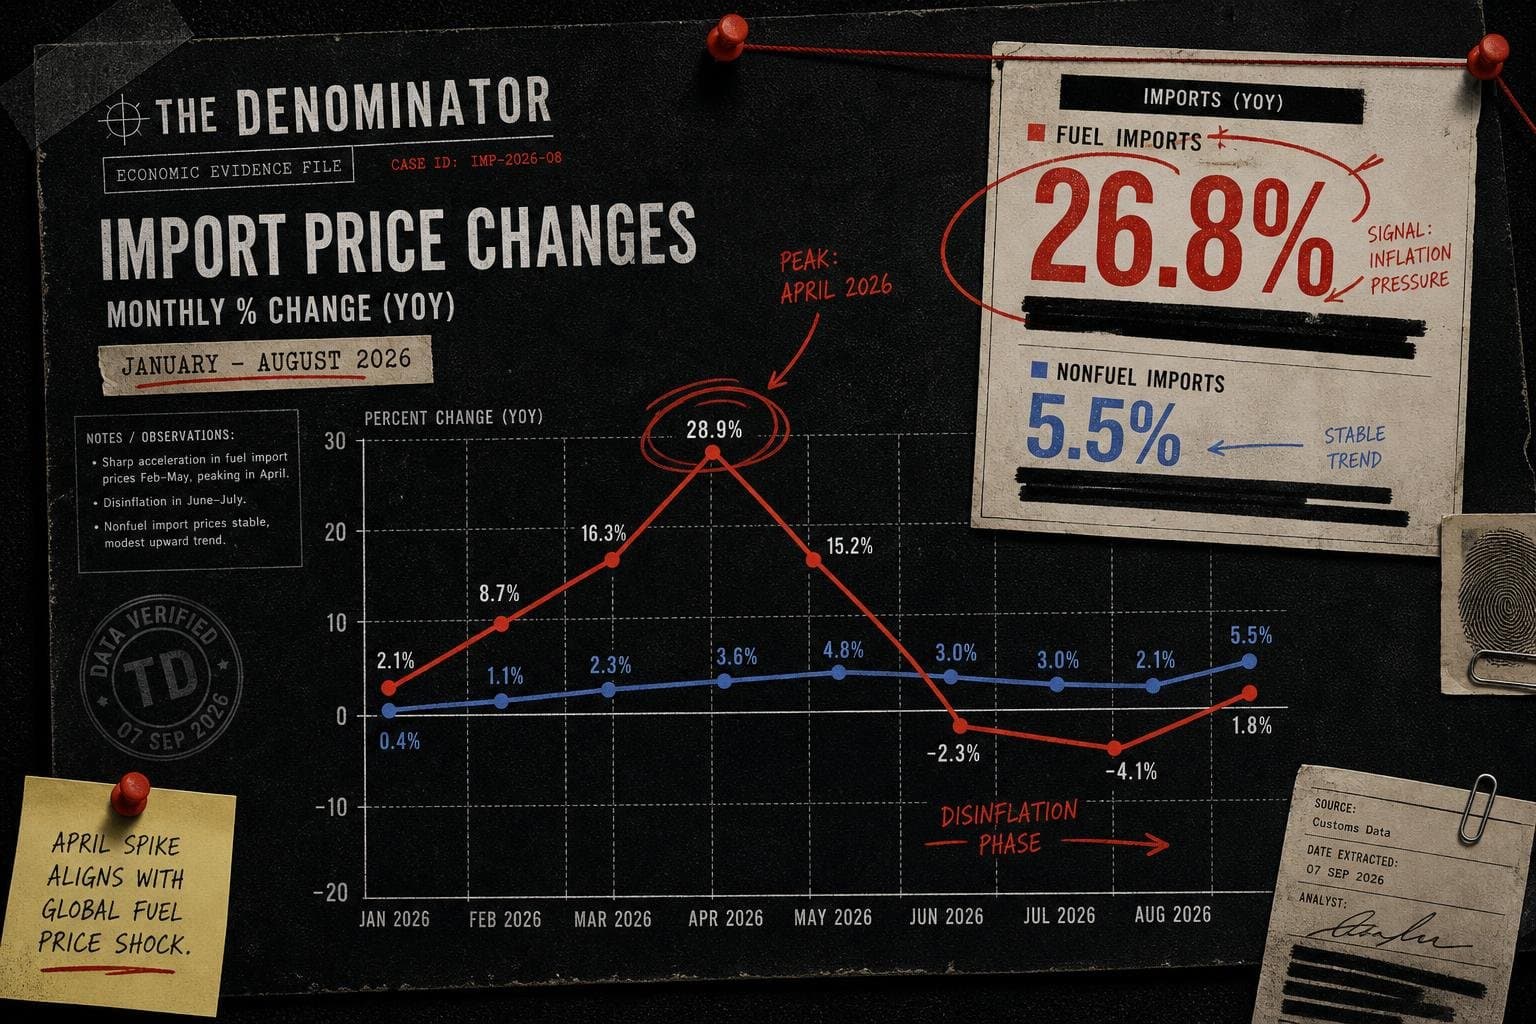

The headline from the BLS August import/export price release is that U.S. import prices rose 7.0% in the 12 months ending August 2026. That's a real number. It's also the wrong place to look.
Here's what the data actually shows — and what the framing around it is missing.
1. The Year-Over-Year Number Hides a Structural Break
The 7.0% annual figure (August 2025 to August 2026) sounds like a smooth trend. It isn't. Look at the monthly sequence in the BLS release:
| Month | All Imports (monthly change) |
|---|---|
| January 2026 | +0.5% |
| February 2026 | +1.0% |
| March 2026 | +0.9% |
| April 2026 | +2.3% |
| May 2026 | +1.8% (r) |
| June 2026 | −0.3% |
| July 2026 | −0.3% (r) |
| August 2026 | +0.7% |
The spike is concentrated in February through May — four months that account for the bulk of the annual accumulation. June and July reversed slightly. August ticked back up. This is a step-change pattern, not a gradual drift. Something happened in early 2026 that repriced imports, and the annual figure is averaging over it.
2. Fuel Is Doing Extraordinary Work — and Then Stopping
Fuel imports rose 26.8% year-over-year (August 2025 to August 2026). The monthly sequence is even more dramatic: fuel imports jumped 18.9% in April alone, then 12.1% in May, then reversed −3.7% in June and −6.6% in July, before nearly flattening at −0.1% in August.
That April spike is the number that should be circled in red. It coincides with the period when new tariff schedules took effect. The reversal in June–July suggests some combination of demand destruction and commodity price normalization — but the annual average still carries the full weight of those spring months.
The comparison that matters: nonfuel imports rose 5.5% year-over-year. That's not trivial. Stripping out fuel doesn't make the story go away — it just removes the most volatile component and leaves a still-elevated core.
3. The Export Side Is Getting Less Attention Than It Deserves
U.S. export prices rose 8.6% year-over-year (August 2025 to August 2026). Non-agricultural exports: up 8.9%. Agricultural exports: up 5.8%.
That's a larger annual increase than imports. Which means the standard "tariffs raise import prices, hurting consumers" frame is incomplete. Export prices are also elevated — which affects U.S. competitiveness abroad and complicates the trade balance arithmetic. The July monthly figure for all exports was −1.4% (revised), suggesting some softening, but the annual accumulation is substantial.
The prior year comparison makes this stark: August 2024 to August 2025, all imports were down 0.3%. All exports were up 3.2%. The 2026 numbers represent a genuine discontinuity, not an acceleration of an existing trend.
4. What the Midwest CPI Adds to the Picture
The BLS Midwest regional CPI for July 2026 shows the all-items index up 3.5% year-over-year, with energy up 14.2% over the same period. The energy component tracks closely with the fuel import price spike. Core (all items less food and energy) was up 2.7% — elevated but not alarming on its own.
The regional data is useful here because it shows the import price shock is transmitting into consumer prices, particularly through energy. The 14.2% energy increase in the Midwest over the 12 months ending July 2026 is not a coincidence when fuel import prices rose 26.8% over roughly the same window.