The number has appeared in congressional testimony, presidential speeches, and roughly ten thousand LinkedIn posts about the fragility of the American middle class. "Half of Americans can't afford a $400 emergency." It is cited as a fact. It comes from a real Federal Reserve survey. And it has been wrong — or at minimum, badly mischaracterized — for most of the decade it has been circulating.
Tracing this one back to its source is a useful exercise not because the underlying problem is fake, but because the gap between the headline and the data reveals exactly how statistical misinformation works in practice: not through fabrication, but through a single framing decision made in 2013 that calcified into received wisdom before anyone checked the denominator.
The Original Sin Was a Collapsed Category
The Federal Reserve's Survey of Household Economics and Decisionmaking — the SHED — has asked about the $400 question since 2013. That first year, 50% of adults said they would cover the expense with cash or its equivalent. Someone flipped that number — "50% would pay cash" became "50% cannot afford it" — and the framing went mainstream after a 2016 Atlantic essay on financial precarity. The underlying measure was always more specific than the headline suggested.
Here is what the survey actually asks: how would you cover a $400 unexpected expense? The response options include cash or savings, a credit card paid off at the next statement, a credit card carried as a balance, borrowing from family or friends, selling something, or being unable to pay at all. The Fed's "cash-equivalent" category includes the first two options. Everyone else gets lumped into "not cash-equivalent."
The leap from "not cash-equivalent" to "cannot afford" is the error. Borrowing from a family member who will lend you $400 interest-free is not the same as being unable to pay. Selling something you own is not the same as being unable to pay. Carrying a credit card balance for one month is not ideal, but it is not the same as being unable to pay. The headline collapsed all of these into a single category and called it inability.
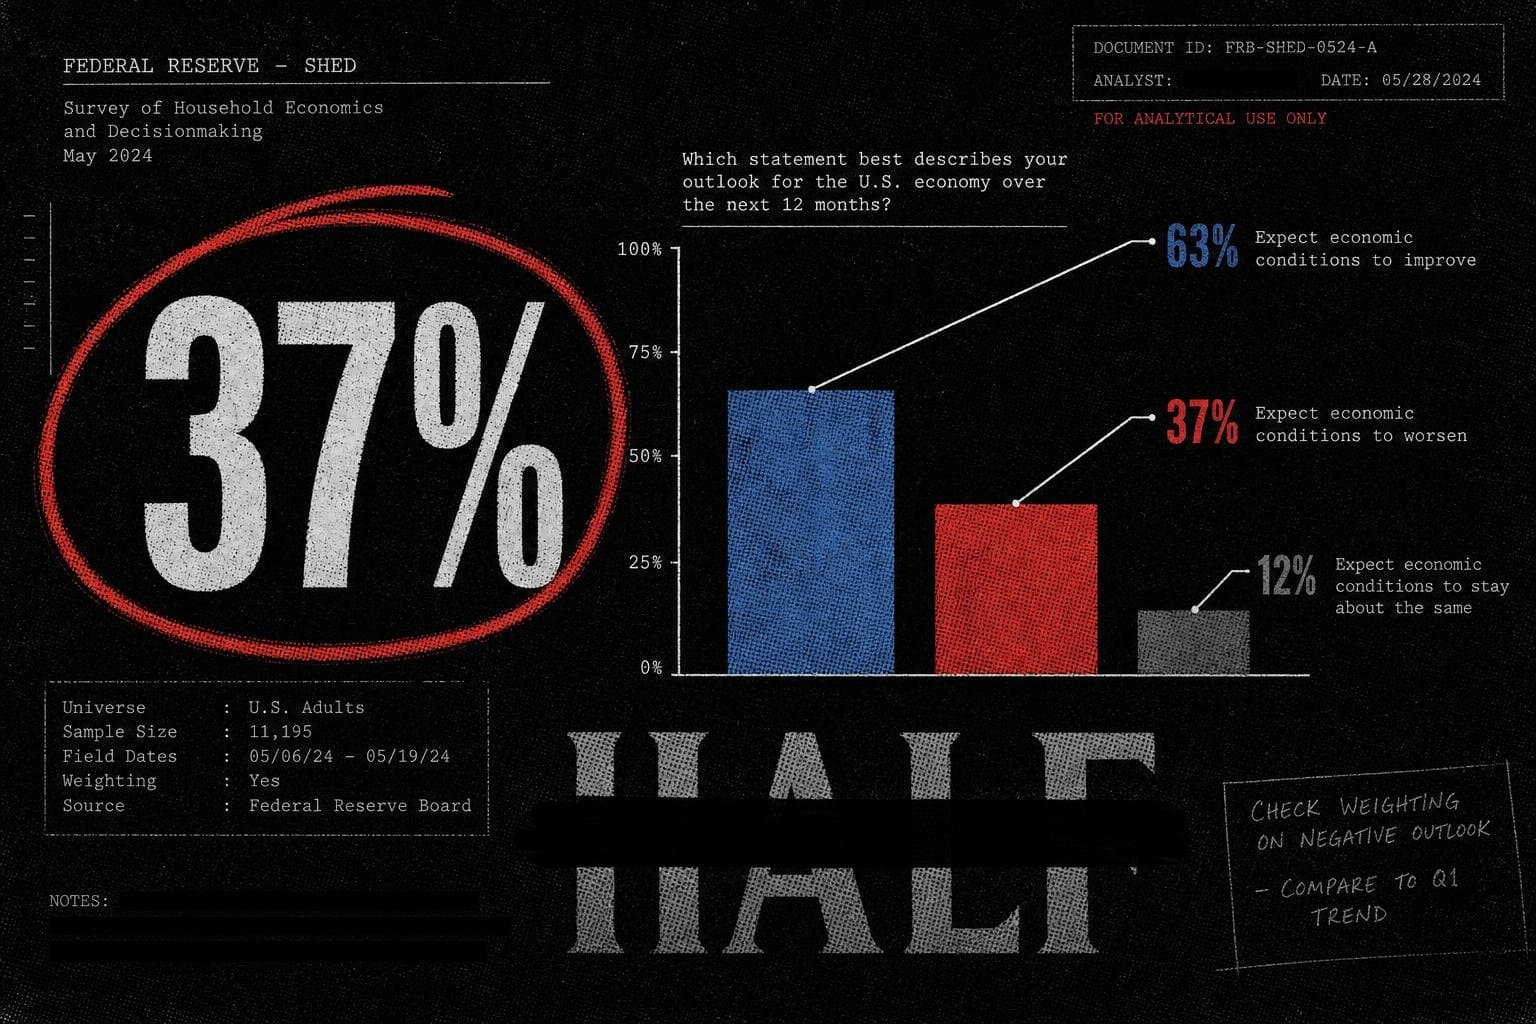
The Fed's 2025 SHED data, released in May 2026, shows 63% of U.S. adults would cover a $400 emergency entirely with cash, savings, or a credit card paid off at the next statement. That leaves 37% who would use some other method. And 12% said they could not pay the expense right now by any means.
Those are three distinct numbers. The headline has been conflating the first and third for a decade.
The Denominator Moved, and Nobody Updated the Headline
The 50% figure was accurate — as a description of 2013. The measure has improved substantially since then, peaked in 2021 at 68%, and has held roughly flat at 63% since 2022. The headline number, meanwhile, stayed frozen at "half of Americans" long after the underlying data had shifted.
This is a specific and underappreciated failure mode: a statistic gets attached to a narrative, the narrative becomes load-bearing in public discourse, and the statistic stops getting updated even as the underlying data changes. The 2013 figure was doing real work in 2016 policy debates. By 2026, it is a twelve-year-old snapshot being presented as current reality.
The correct 2025 figures, kept separate:
- 63% of U.S. adults would cover $400 with cash or a card paid immediately — the "cash-equivalent" group.
- 37% would use some other method — borrowing, selling, carrying a balance, or being unable to pay.
- 12% say they could not pay by any means right now.
The 12% figure is the one that most directly maps to what the headline claims to be measuring. It is a real and serious problem. Roughly one in eight American adults cannot cover a $400 emergency expense. That deserves attention. It is also materially different from "half of Americans," and the difference matters for policy design, for resource allocation, and for understanding which interventions would actually help.
Why the Misquote Persists: The Incentive Structure of Alarming Statistics
The "$400" stat is a case study in what might be called the advocacy ratchet. A real finding — financial fragility is widespread — gets expressed in the most alarming available framing. The alarming framing spreads faster than the nuanced one. Corrections are less shareable than the original claim. And the people most motivated to cite the statistic are the ones for whom the alarming version is most useful, so the correction never reaches the same audience.
This is not unique to any political direction. The "$400" stat has been used by politicians across the spectrum to argue for everything from expanded social programs to deregulation to cryptocurrency adoption. The number is flexible precisely because it has been detached from its methodology. Once you stop asking "compared to what?" and "measured how?", a statistic becomes a rhetorical Swiss Army knife.
The House of Commons Library's fact-checking guidance — written for a different context but applicable here — frames the core discipline as tracing a claim back to its original source and considering its original context. That's the step that gets skipped. The Atlantic essay cited the Fed survey. Subsequent citations cited the Atlantic essay. By the fifth generation of citation, the methodology had evaporated entirely.
There is also a subtler problem: the Fed's survey measures adults, not households. The headline says "Americans" or sometimes "households," which implies a different unit of analysis. A household with two adults where one would pay cash and one would borrow from family is not a household that "cannot afford $400." The unit-of-analysis error compounds the category-collapse error, and together they produce a headline that is wrong in at least two independent ways.
What the Actual 12% Tells Us — and What It Doesn't
The 12% figure — adults who say they could not pay a $400 emergency by any means — is the number that should be doing the work in policy conversations. It represents roughly 31 million adults, using the Census Bureau's current U.S. adult population estimates. That is a large number. It is also a self-reported survey figure, which carries its own methodological caveats.
Self-reported financial capacity is not the same as measured financial capacity. People systematically underestimate their ability to access resources under pressure — family networks, credit lines, employer advances — that they would not think to mention when answering a survey question about a hypothetical emergency. This does not mean the 12% is wrong; it means it is a floor estimate of a specific kind of financial stress, not a precise headcount of people who would literally be unable to handle the expense.
The SHED is a survey-based observational study, not a randomized controlled trial. It measures stated intentions about hypothetical scenarios, not actual behavior. The Fed has been transparent about this — the survey notes are explicit that the question captures how people think they would respond, not how they actually do. That distinction matters when the number gets used to argue for specific policy interventions, because the gap between stated intention and actual behavior can be substantial.
None of this makes the finding useless. A large share of American adults — whether 12% or somewhat more — are in genuinely precarious financial positions. The SHED data is consistent with other indicators of financial stress. The problem is not the data. The problem is the headline that replaced the data.
The Broader Pattern: When the Correction Requires More Words Than the Claim
The "$400" case illustrates a structural asymmetry in statistical communication. The wrong version — "half of Americans can't afford a $400 emergency" — is eleven words. The correct version requires explaining what "cash-equivalent" means, distinguishing between payment method and inability to pay, noting that the figure has changed since 2013, separating the 37% from the 12%, and flagging that the survey measures adults not households.
That is not eleven words. It is a paragraph. And in a media environment where the eleven-word version has already been shared ten thousand times, the paragraph is always going to lose the distribution race.
This is the denominator problem in its purest form. The alarming headline is not fabricated — it traces to a real survey, a real federal agency, a real finding. But the denominator got dropped. The category got collapsed. The year got frozen. And the result is a statistic that is simultaneously sourced and misleading, which is the most durable kind of misinformation there is.
The BLS faces a version of this problem constantly — its headline unemployment rate (U-3) gets cited without the broader U-6 measure that includes discouraged workers and part-time workers who want full-time work, producing a systematically rosier picture than the underlying data supports. The Fed's SHED faces it with the $400 question. The pattern is not specific to any agency or any topic. It is what happens when a complex measurement gets reduced to a single shareable number and the methodology gets left behind.
The fix is not to stop citing the Fed survey. The fix is to cite it correctly: 63% would pay cash-equivalent, 37% would not, 12% say they could not pay at all — and those are 2025 figures, not 2013 ones. The underlying problem of financial fragility is real. It does not need a misquote to make it compelling.
Watch for the Fed's 2026 SHED release, expected in spring 2027, to see whether the 63% figure holds or shifts as the interest rate environment changes. That's the number worth tracking — not the frozen headline from a survey cycle that ended twelve years ago.


