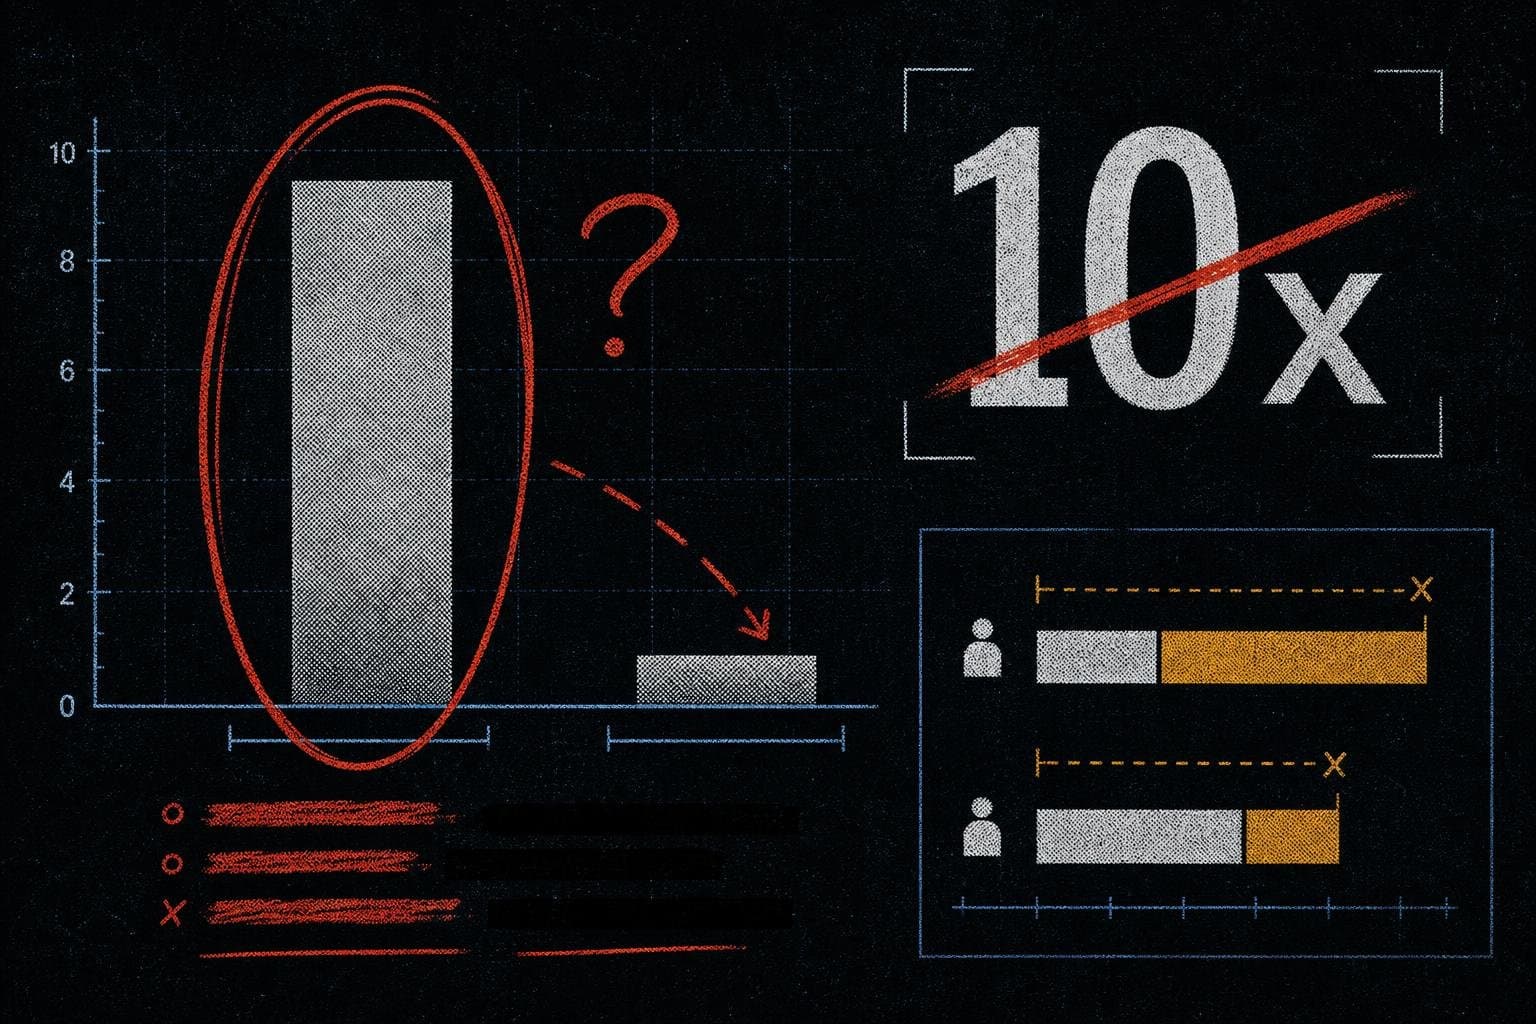

The number circulating in regulatory offices across Europe is a clean, confident ratio: Tesla's Full Self-Driving feature is up to 10 times safer than a human driver. It appears in Tesla's own safety reports. Elon Musk and other executives have cited it repeatedly. And according to Reuters reporting from June 15, Tesla presented that figure directly to regulators in Sweden and the Netherlands as part of its effort to secure European approval for FSD.
The problem isn't that the number is fabricated. The problem is what it's being compared to.
The Denominator Is Doing All the Work
When you hear "10 times safer than human drivers," the natural assumption is that someone compared FSD miles driven to human miles driven under similar conditions, then counted crashes. That would be a reasonable methodology. It's not what Tesla did.
Reuters' earlier investigation found several invalid data comparisons underlying Tesla's statistics. The specific methodological flaws aren't fully detailed in the available excerpts, but the core critique from independent traffic-safety researchers is consistent: Tesla's self-published safety statistics amount to misleading marketing, not rigorous comparative analysis.
This is a familiar pattern. The "compared to what?" question is where safety statistics go to die. Human driver crash rates vary enormously depending on road type, time of day, weather, geography, and driver demographics. A system that logs most of its miles on well-mapped suburban highways in favorable conditions will produce a very different crash rate than one measured against the full distribution of human driving. If the comparison population isn't matched to the test population, the ratio is meaningless — or worse, actively misleading. It's the same denominator trap this publication has tracked in public health reporting and economic statistics alike: a number can be calculated correctly from a flawed comparison and still be wrong in every way that matters.
Tesla's FSD, per Reuters' reporting on the Austin robotaxi launch, was prepared for deployment through months of intensive local route mapping and hazard training by internal staff — work that four former employees described as impossible to scale broadly. That's not a system operating in the wild. That's a system operating in a carefully prepared environment. Comparing its crash rate to the general human driver population is like comparing a professional driver on a closed course to commuters on the 405.
What Regulators Are Actually Seeing
The European angle sharpens the stakes. Tesla approached the Dutch road regulator RDW in late 2024 to begin the FSD approval process, and in a November 2024 letter provided a link to its safety report with the claim that increased FSD usage "leads to safer roads," according to Reuters' June 15 report. Sweden's response is instructive: regulators there said they "look beyond headline figures" to assess safety.
That's a polite way of saying: we noticed the denominator problem.
The issue isn't just that Tesla's statistics are optimistic. It's that self-published safety data presented to regulators as evidence of approval-worthiness is a category error. A company's own crash reports, constructed using the company's own methodology, without independent audit or peer review, are claims to investigate — not evidence to accept. The OECD's 2026 Digital Government Outlook makes a related observation about AI governance broadly: that artificial intelligence "is advancing faster than the trust mechanisms needed to steward it." Tesla's self-certified safety statistics are a case study in exactly that gap. The Reuters examination was built on public records requests and interviews with nine former data labelers and a former Tesla self-driving engineer — the kind of methodology check that should precede regulatory reliance on any safety statistic, not follow it.
The Broader Pattern Worth Watching
Tesla's FSD statistics are a vivid example of a problem that runs through safety and technology claims generally: the gap between a number's precision and its validity. "Up to 10 times safer" sounds like it emerged from a rigorous study. It has a denominator. It has a ratio. It feels like data.
But precision isn't accuracy. A number can be calculated correctly from a flawed comparison and still be wrong in every way that matters. The "up to" qualifier is doing additional work here — it means the ratio applies under some conditions, not necessarily the conditions regulators care about.
Consider the contrast with how government statistical agencies handle the same challenge. The BLS release for May 2026 — a 4.2% all-items CPI increase over the year ended May 2026, the largest 12-month gain since April 2023 — comes with full methodology, sample construction, and historical comparisons published alongside it. That's what a number you can actually use looks like. Tesla's safety statistics, by contrast, are self-reported, methodologically opaque, and now the subject of two separate Reuters investigations.
The journalism ethics question lurking here is also worth naming. ProPublica recently updated its code of ethics to address conflicts of interest in an environment where financial incentives increasingly intersect with information — a reminder that the credibility of any statistical claim depends partly on who constructed it and what they stood to gain. Tesla charges a monthly subscription for FSD. Its safety statistics are also its marketing copy. Those two facts belong in the same sentence.
The next question worth watching: whether European regulators formally reject the FSD application on methodological grounds, or whether the "look beyond headline figures" posture translates into actual approval delays. A regulator who says they check the denominator but approves anyway has told us something important about how much the denominator actually matters.


