


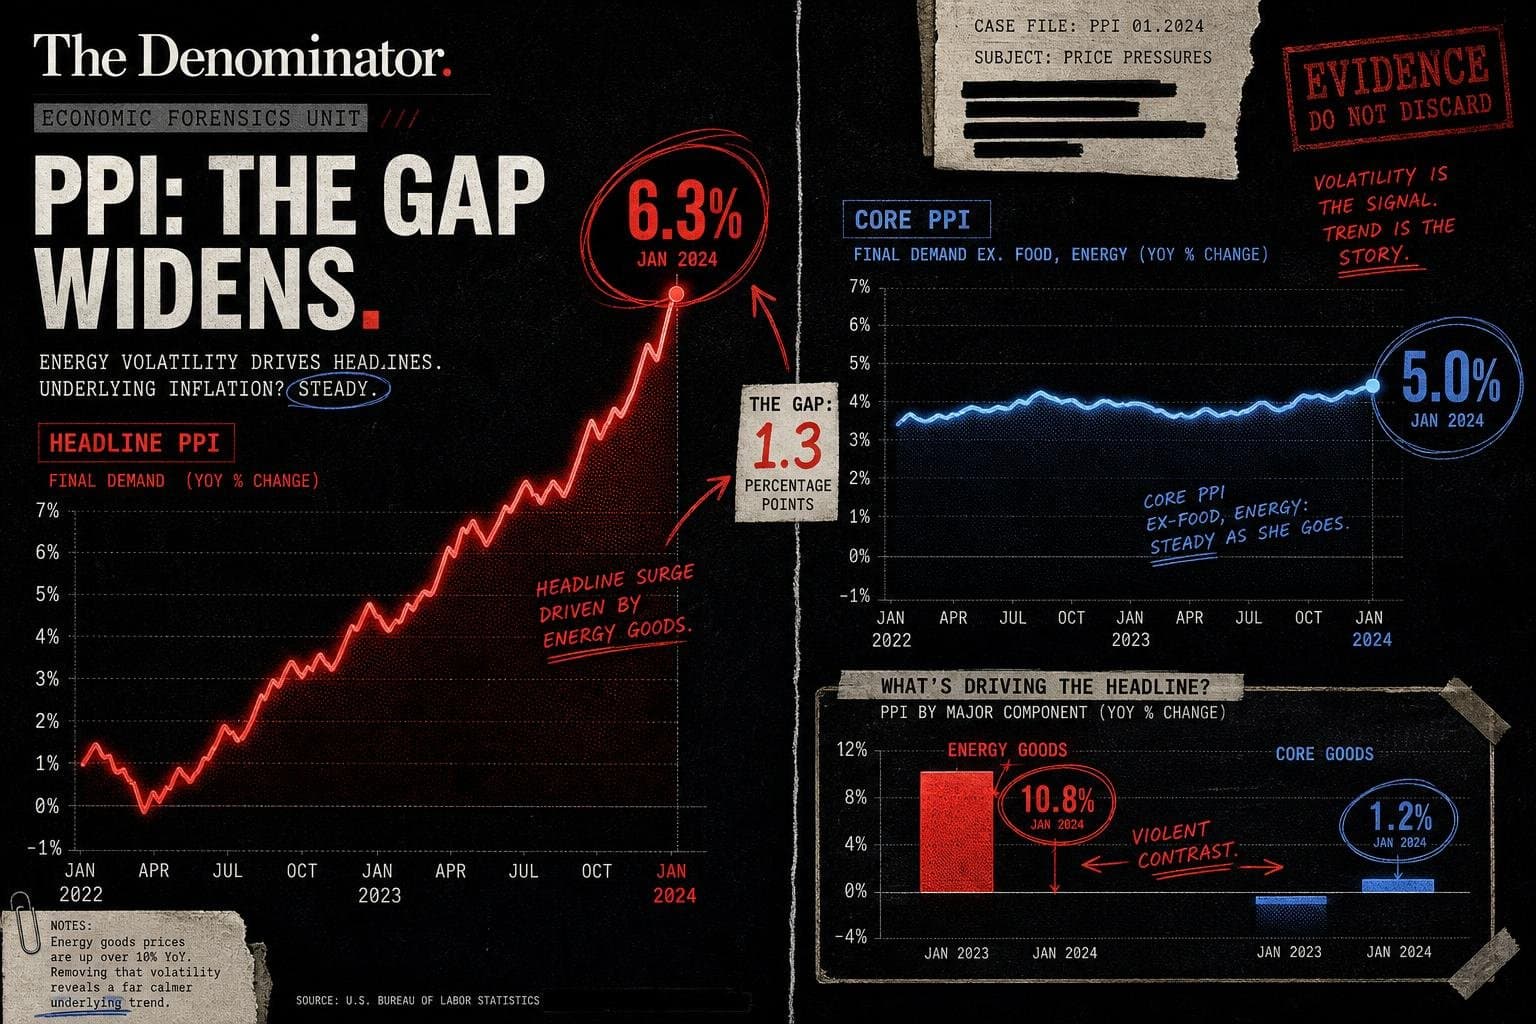

The headline from the Bureau of Labor Statistics' September Producer Price Index release is that wholesale prices rose 6.3% year-over-year through September 2026. That's the biggest annual increase in this series since the current run of revisions began, and it's going to show up in a lot of "inflation is roaring back" headlines this week. It's also, on its own, close to useless as a diagnostic tool — because it bundles together two very different stories that deserve to be told separately.
The Core Number Tells a Calmer Story
Buried in the same BLS table is a second figure: final demand prices excluding foods, energy, and trade services — the Fed's preferred lens for seeing through short-term noise — rose 5.0% over the same 12 months. That's still elevated by historical standards, but it's 1.3 percentage points below the headline. In a series where the gap between headline and core has been widening for months — it was effectively nonexistent back in July 2026, when headline and core converged at 4.9% — a 1.3-point spread in September is the story, not a footnote to it.
Where's the spread coming from? Final demand energy goods jumped 10.8% in September alone, month-over-month, according to the same release. That single category is the largest mover in the entire table. Compare that to final demand goods less foods and energy, which rose a comparatively modest 1.2% for the month. Energy is volatile by nature — it was down 6.8% just two months earlier, in June 2026, per the same BLS data — which is exactly why the core measure exists: to strip out the category most likely to produce a one-month headline that doesn't describe the underlying trend.
Why the Distinction Matters for the Next CPI Print
PPI is a leading indicator for consumer prices, which means this September number will get cited as evidence that consumer inflation is about to reaccelerate. That's plausible — producer costs do eventually show up at the register — but the causal chain runs through the composition of the increase, not just its size. A PPI spike driven by a one-month energy swing doesn't pass through to consumers the same way a broad-based increase in core goods and services does. If energy settles back down next month the way it has in five of the last twelve months shown in the BLS table, the headline number could fall just as fast as it rose, while the core trend — the one actually worth watching — keeps grinding along at its own, steadier pace.
This isn't a new trick. I've flagged the gap between headline and core PPI before, in July, when the two numbers happened to land on the same figure and nobody had reason to notice the seam. The seam is back, and it's wider. That's the part of this release worth sitting with: not whether 6.3% is a big number — it is, relative to the 3.0% year-over-year reading from September 2025 shown in the same series — but whether the number you're being handed is measuring what you think it's measuring.
What to Watch
The next data point worth checking is whether October's energy goods index reverses, the way it has in six of the past thirteen months in this same table. If it does, expect a public round of "inflation cooled" headlines built on the same unexamined headline-versus-core gap, just pointed in the other direction. The more durable signal is the core trend line — final demand less foods, energy, and trade — which has moved from 3.4% to 5.0% year-over-year over the twelve months captured in this release. That's a real move, it's a slower one, and it's the number that should anchor whatever story gets told about producer prices into the winter.