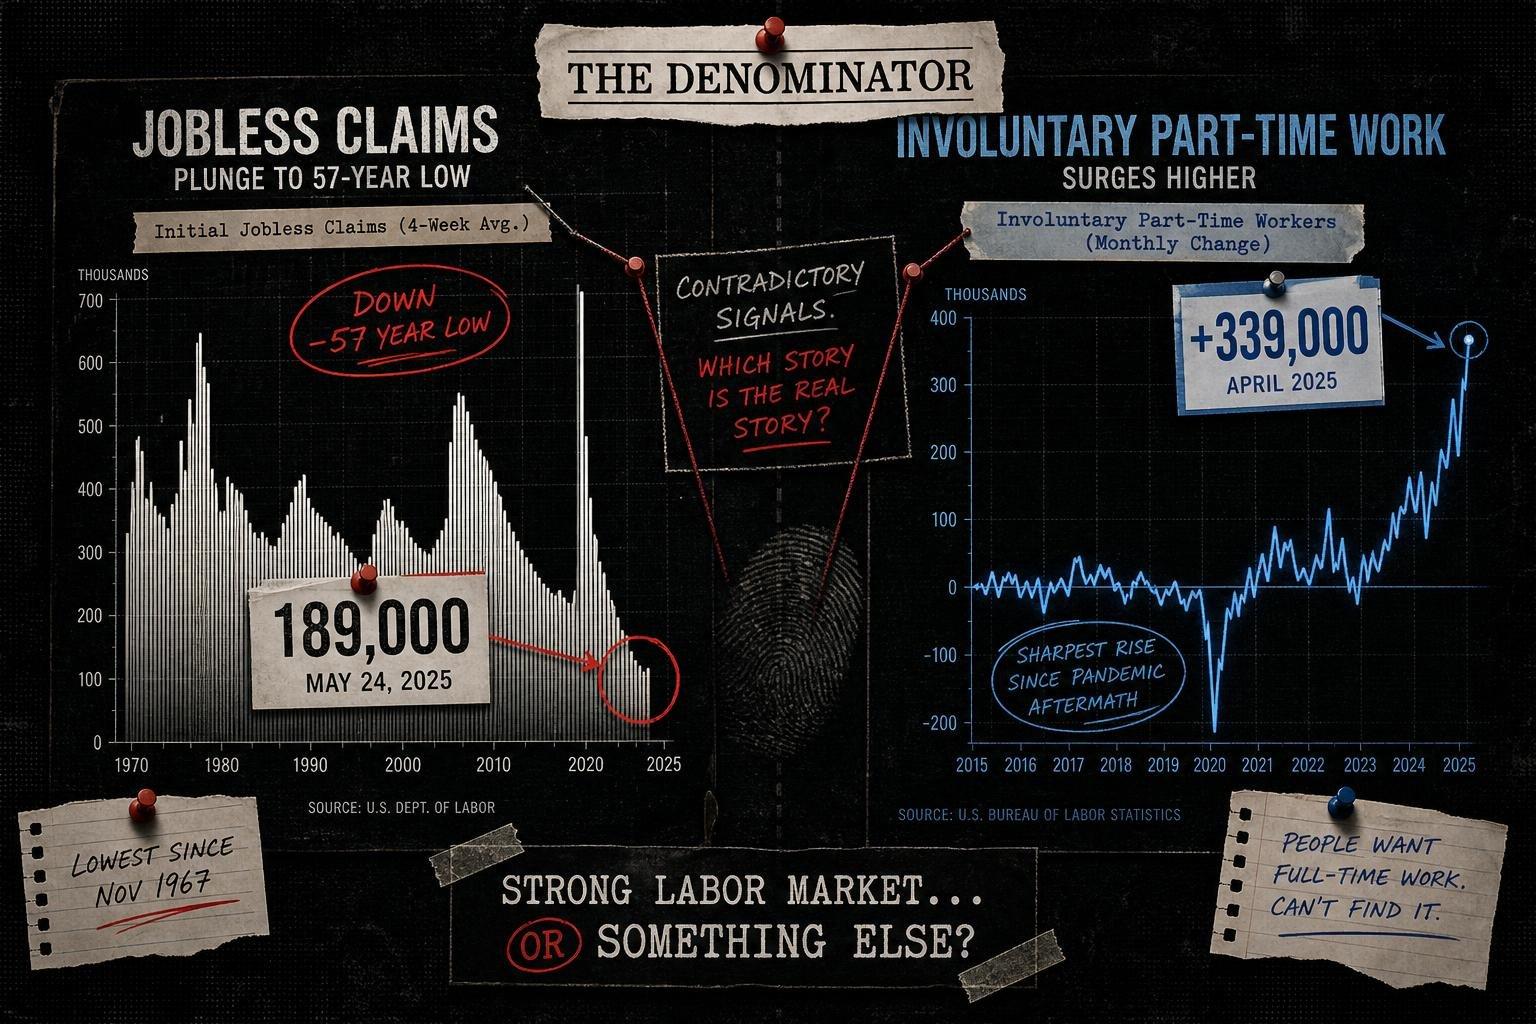

Two labor market data points landed within days of each other this month, and they tell completely different stories depending on which one a headline writer picked up first.
The optimistic number: initial jobless claims fell 6,000 to a seasonally adjusted 189,000 for the week ended October 31, matching the lowest level since 1969, according to Reuters. Economists had forecast 196,000. Layoffs look scarce.
The number nobody led with: involuntary part-time employment — people who want full-time work but can't get it — rose 339,000 in a single month, from 4.50 million in September 2026 to 4.84 million in October 2026, according to the Bureau of Labor Statistics. Most of that increase — 356,000 people — came from workers whose hours were cut due to slack work or weak business conditions, not from people who simply prefer shorter weeks, per the same BLS release.
Compared to what?
"57-year low" sounds like a floor. But jobless claims only measure layoffs severe enough to trigger a new unemployment filing. They don't capture what happens to someone whose employer cuts their hours from 38 to 22 instead of letting them go. That worker shows up nowhere in the claims data and fully in the BLS part-time figures.
Meanwhile continuing claims — people still collecting benefits — actually rose 23,000 to 1.718 million in the same week, per Reuters. Low claims plus rising continuing claims is a specific pattern: fewer people are newly losing jobs, but the ones who already lost theirs are taking longer to find new ones. That's not the same story as "resilient labor market," even though both facts are true simultaneously.
The employer-side numbers cut both ways too
Challenger, Gray & Christmas data cited by Reuters shows planned layoffs rose 2% month-over-month in October 2026 but fell 71% compared with October 2025 — and were still the lowest for any October since 2023. Hiring announcements, meanwhile, jumped 57% from October 2025 to the highest October total since 2009. Three different comparison windows, three different impressions. Pick the year-over-year framing and it's a boom. Pick the month-over-month framing and hiring intentions actually ticked down from September.
The job-openings-to-unemployed ratio hit 1.06 in September 2026, up from 1.02 in August — a tightening signal that sits awkwardly next to rising continuing claims and the rise in involuntary part-time work from the following month. These aren't contradictory in a "the data is wrong" sense. They're measuring different slices of the same labor market, and none of them is complete on its own.
Worth noting, as a matter of statistical hygiene: when the Census Bureau releases comparative demographic estimates, it flags that every comparative statement has been tested and is significant at the 10% level "unless otherwise noted" — a disclosure habit that monthly jobs and claims releases could stand to borrow. None of the labor figures above come with that kind of significance flag attached in the headline reporting.
What's correlation, what's not
The Labor Department also reported a surge in third-quarter worker productivity that pushed labor costs down for the first time in over a year, which Reuters notes is reinforcing the view among policymakers that the labor market isn't driving inflation. That's an association, not a causal claim — the productivity surge and the inflation picture moved together in the same quarter, which is a different statement than "productivity caused lower inflation." The reporting treats it as a reinforcing data point for existing Fed thinking, not a mechanism, and that distinction matters when this gets simplified into "productivity is cooling inflation" by the time it reaches a cable chyron.
What to watch
The next BLS Employment Situation report will show whether October's part-time jump was a one-month blip tied to specific sectors or the start of a trend — and whether continuing claims keep climbing even as new filings stay low. A single month of hours-cutting doesn't make a recession signal. Two or three in a row would.


