



In early August, election workers in Stevens County, Washington, walked across the street to check a mailbox for late primary ballots. They expected a few dozen. They found more than 500, each one a vote that would not count, according to ProPublica's reporting. The county auditor called it "jarring."
A raw count like that is good copy and bad evidence. Five hundred late ballots sounds alarming until you ask the question this newsletter exists to ask: compared to what? ProPublica actually did that work, and the comparison is what makes the story hold up rather than just sound bad.
The Comparison Year Does the Heavy Lifting
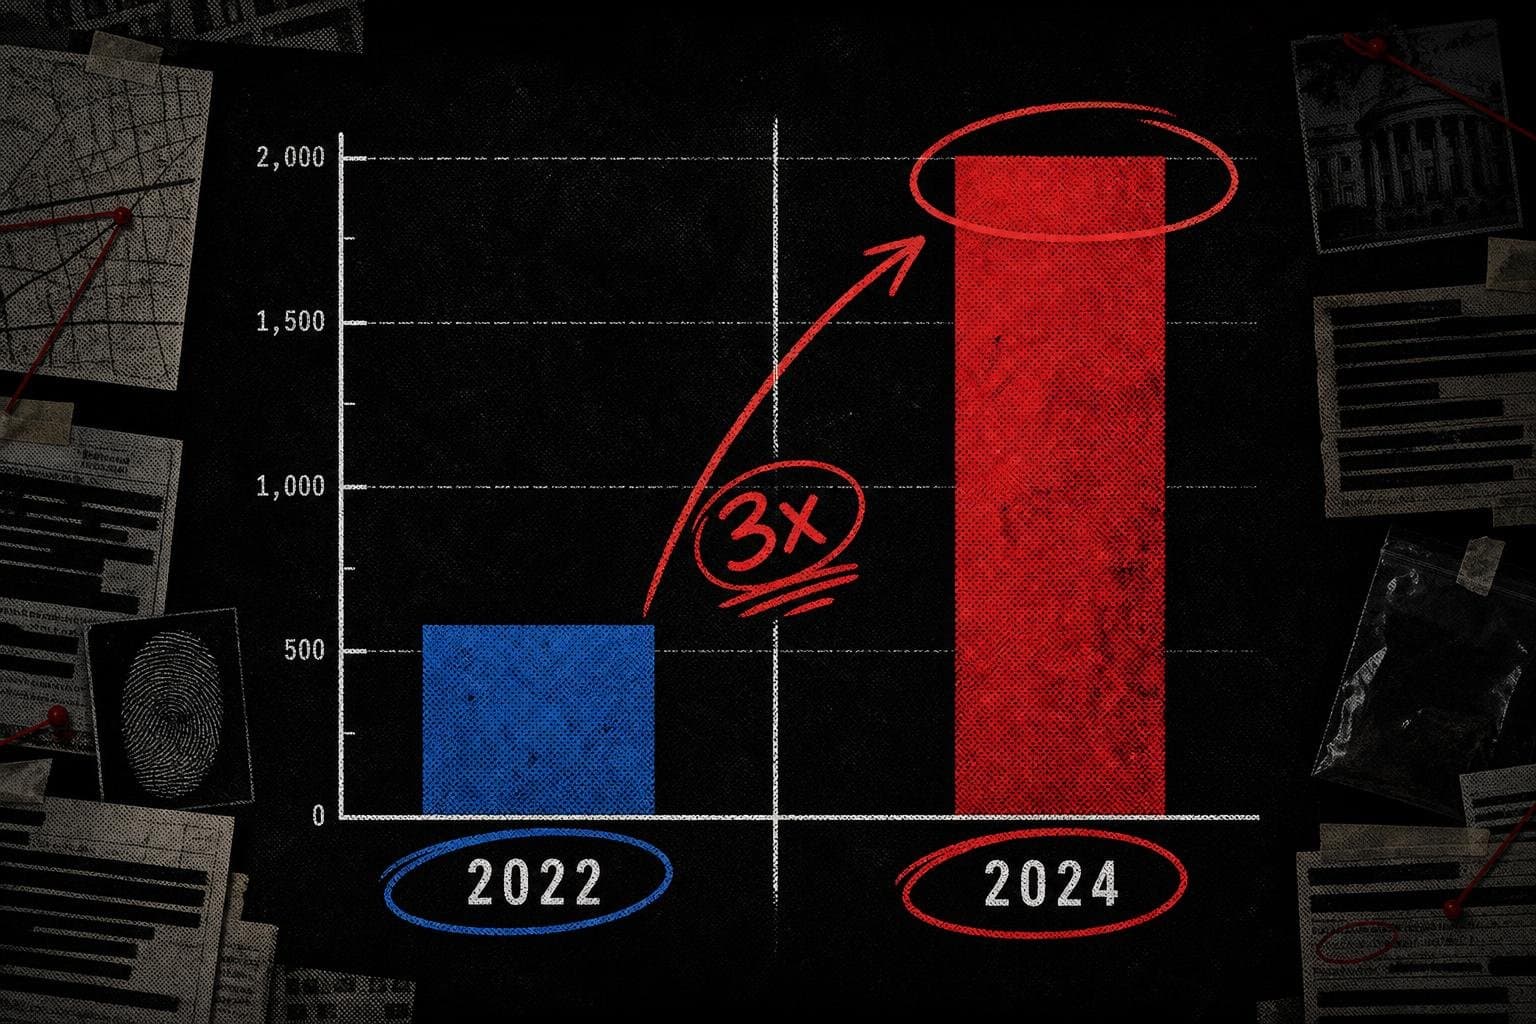
Across 11 predominantly rural counties in eastern Washington, nearly 2,000 ballots arrived too late to count this cycle, versus about 600 in the 2022 primary — the last comparable midterm cycle, per ProPublica. That's roughly a tripling, year over year, in the specific counties affected by U.S. Postal Service cost-cutting and consolidation.
The part that actually earns the causal language ProPublica uses is the control group embedded in the reporting: the increase in late-ballot rejections didn't happen everywhere. It concentrated in areas hit by the USPS service changes, while rates stayed flat elsewhere, according to the same analysis. That's a quasi-experimental structure — treatment counties versus untreated counties, same election type, same state, two election cycles apart — and it's a meaningfully stronger design than "ballot rejections went up, and also the Postal Service made cuts, therefore."
I still want to flag what this is and isn't. This is an observational comparison, not a randomized trial — nobody assigned postal service cuts to some counties and not others. The counties that got hit by service reductions may differ from the ones that didn't in ways that also affect ballot timing: rural mail routes, population density, how far voters live from a processing center. ProPublica's comparison group design controls for the "did overall mail volume or election rules change" confound reasonably well, but it doesn't rule out every alternative explanation. The honest version of this story is "USPS service reductions are strongly associated with a tripling of late-ballot rejections in affected rural counties, comparing 2026 to 2022" — not "USPS cuts caused 1,400 ballots to be thrown out." ProPublica's own language — "delays resulting from" — leans a notch more causal than the underlying comparison strictly proves, even though the design is better than most.
What's Missing Is the Denominator Everyone Skipped
Here's the gap I can't close with what's in front of me: none of the reporting states what share of total ballots cast in those 11 counties these rejections represent. Nearly 2,000 late ballots is a big number against 600. It's a much smaller number against, say, 300,000 total ballots cast than against 20,000. Without the denominator — total mail ballots returned in those counties this cycle — I can tell you the rejection count roughly tripled, but I can't tell you whether the rejection rate moved from a rounding error to a real problem, or from a real problem to an emergency. That distinction matters enormously for policy, and it's the first thing I'd want from a follow-up Census or state elections data pull.
The other missing number is simpler: how many counties, total, did ProPublica examine to find these 11? If the analysis started with 11 counties and found a spike in 11, that's a very different confidence level than if it screened 60 counties statewide and the spike only showed up in these 11. The piece doesn't say, and I'm not going to pretend it does.
Watch November 3
Postal Service leadership has said special procedures for the Nov. 3 election should prevent a repeat, though election experts quoted in the same reporting warn mistakes are likely, per ProPublica. The number to watch isn't whether late ballots happen again — they always do, at some baseline rate. It's whether the gap between treated and untreated counties closes or widens compared to this August's tripling. If the eastern Washington counties converge back toward the rest of the state's rejection rate, that's evidence the "extraordinary measures" worked. If the gap holds, the correlation starts looking a lot more like a cause, comparison year or not.