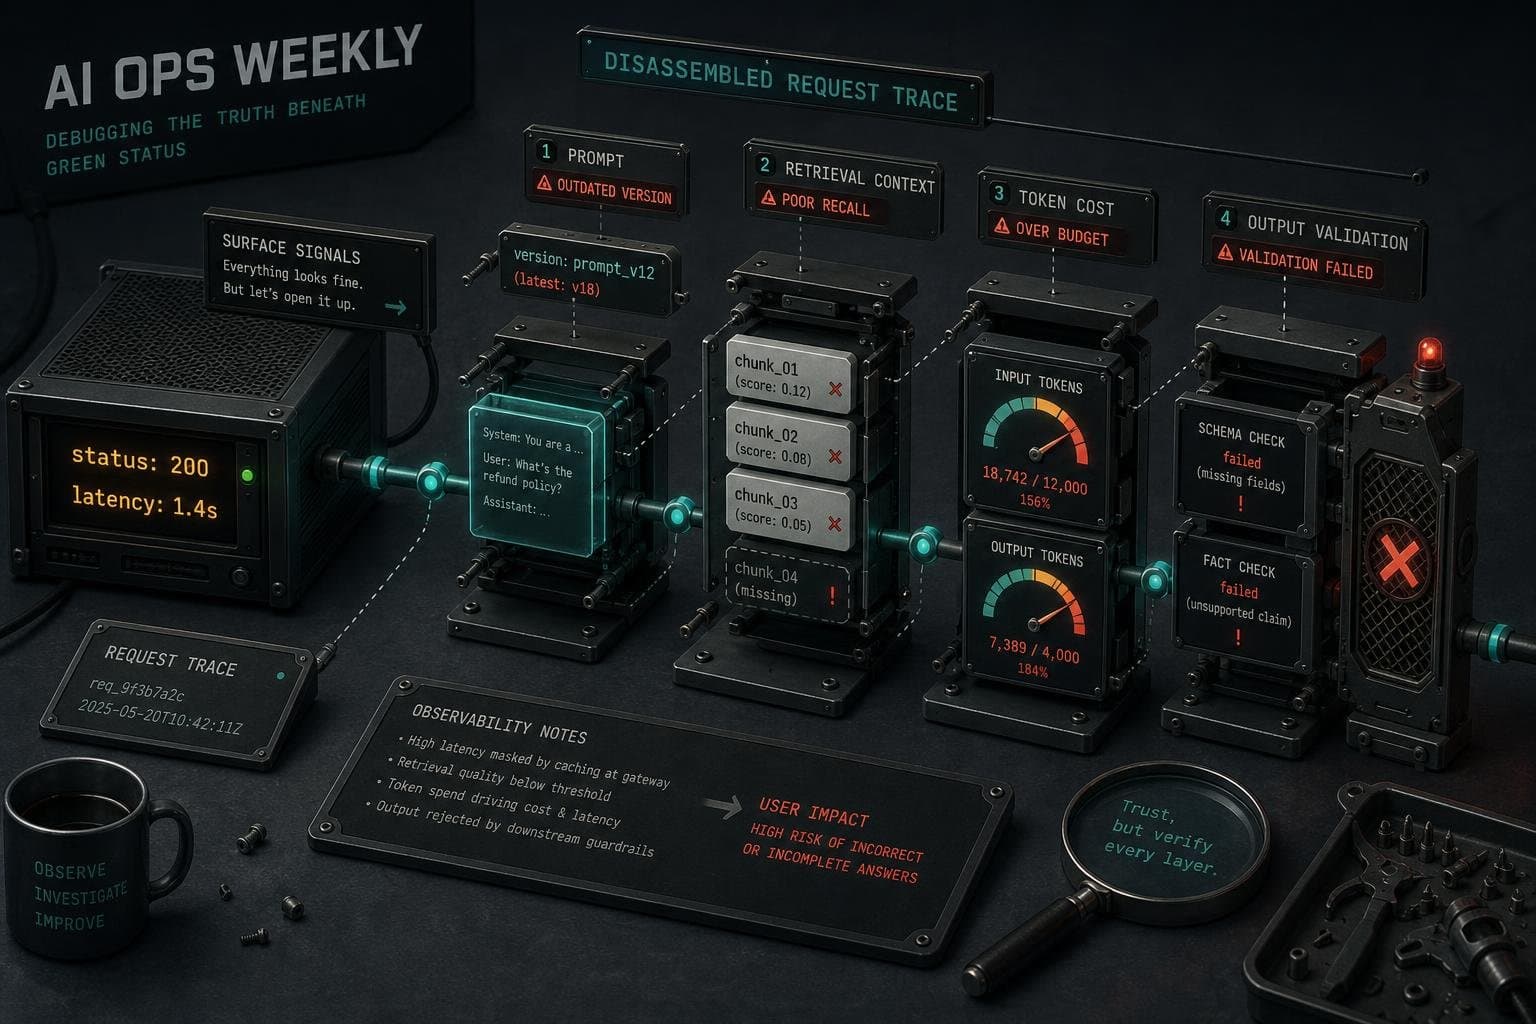

A request comes in. The model returns something wrong. You open your logs and find: status: 200, latency: 1.4s, tokens: 847. Completely healthy. Completely useless.
This is the default state for most small teams running AI features in production. The infrastructure metrics are green. The prompt is broken. And you have no idea which version of the prompt caused it, which retrieval step fed it bad context, or whether this failure is new or has been happening quietly for three weeks.
We've covered prompt versioning before — the discipline of treating prompt edits as deployable artifacts. But versioning is only half the problem. The other half is what you actually log when a versioned prompt runs. Most teams log the wrong things, and when something breaks, they're left guessing.
The Gap Between "Request Succeeded" and "Request Worked"
The core problem is that LLMs fail in a way traditional monitoring was never built to catch. As PromptLayer's observability guide puts it: a request can return a 200 status code, complete in 2.4 seconds, and still give the user a wrong answer, call the wrong tool, exceed your cost target, leak private context, or ignore part of the prompt.
Your existing APM stack sees an HTTP call. It doesn't see that the model returned plain text where your downstream system expected JSON, or that the retriever pulled three irrelevant chunks before the model hallucinated a confident answer from them. Those failures are invisible to infrastructure-layer monitoring because they live in the content, not the transport.
The fix isn't a better dashboard. It's logging at the right layer of abstraction.
What a Useful Prompt Log Actually Contains
The minimum viable trace for a prompt failure has four components that most teams skip:
The exact prompt that ran, pinned to a version. Not the template — the rendered prompt, with all variables substituted, exactly as it was sent to the model. Without this, you can't reproduce the failure. Langfuse's observability model treats prompts as versioned artifacts and connects each trace back to the specific prompt version that generated it — so when you filter traces by a deployment date, you're filtering by the actual instruction set, not just a timestamp.
The retrieval context, if you're using RAG. This is the one teams most consistently skip. Braintrust's tracing overview makes the distinction cleanly: logs show you the final output, traces reveal the retrieval context and reasoning steps that produced it. A wrong answer from a RAG pipeline is almost never a model failure — it's a retrieval failure that the model faithfully amplified. If you're not logging what the retriever returned, you're debugging the wrong component.
Token-level cost per span, not just per request. When a multi-step agent workflow blows your cost budget, aggregate token counts tell you the total damage but not where it happened. Step-level token logging lets you see that step 3 — the one where you're summarizing retrieved documents before passing them to the reasoning step — is responsible for 60% of your spend. That's an optimization target. A single number isn't.
The output shape, not just the output. If your downstream system expects structured JSON and the model returns prose, log the validation result alongside the raw output. Calsoft's prompt evaluation framework documents exactly this failure mode: a model provider pushed a routine update, and instructions that had run clean for four months started returning plain text instead of the JSON a downstream ticketing system expected. Two engineers spent two days debugging their own code before anyone checked the model version. Logging output shape validation would have surfaced the issue in minutes.
The Debugging Workflow That Actually Closes the Loop
Capturing the right data is necessary but not sufficient. The other half is making it queryable in a way that supports a real debugging workflow, not just post-hoc archaeology.
W&B Weave's debugging guide frames this well: LLM monitoring matters because the systems are nondeterministic, and without proper observability it becomes difficult to pinpoint why an application is failing. The practical implication is that you need to be able to filter traces by prompt version, by output validation result, and by user cohort — not just by time range and status code.
The workflow that actually works: when a failure is reported, you should be able to pull all traces from the current prompt version, filter to the ones where output validation failed, and see the retrieval context for each. That's a five-minute investigation. Without structured traces, it's a two-day one.
For teams on tight budgets, Langfuse's self-hosted option keeps your trace data under your own control and avoids per-seat pricing that scales badly as request volume grows. The instrumentation overhead is low — a decorator on your pipeline functions and a few lines of SDK configuration.
The logging infrastructure for prompt debugging isn't complicated. The gap is almost always the same: teams instrument at the HTTP layer and wonder why they can't debug at the prompt layer. Fix the abstraction mismatch first. The tools to do it are already there.


