
A request comes in. It takes four seconds to return. Your GPU utilization looks fine. Your error rate is zero. Your logs show a 200. And you have absolutely no idea what just happened.
This is the defining frustration of debugging LLM latency in production: the metrics that tell you something is wrong are completely separate from the metrics that tell you where. Traditional APM tooling was built for stateless microservices where every request costs roughly the same and retries are cheap. LLM inference violates both assumptions simultaneously — and the failure modes hide in the gap.
Prefill and Decode Are Different Problems. Treat Them That Way.
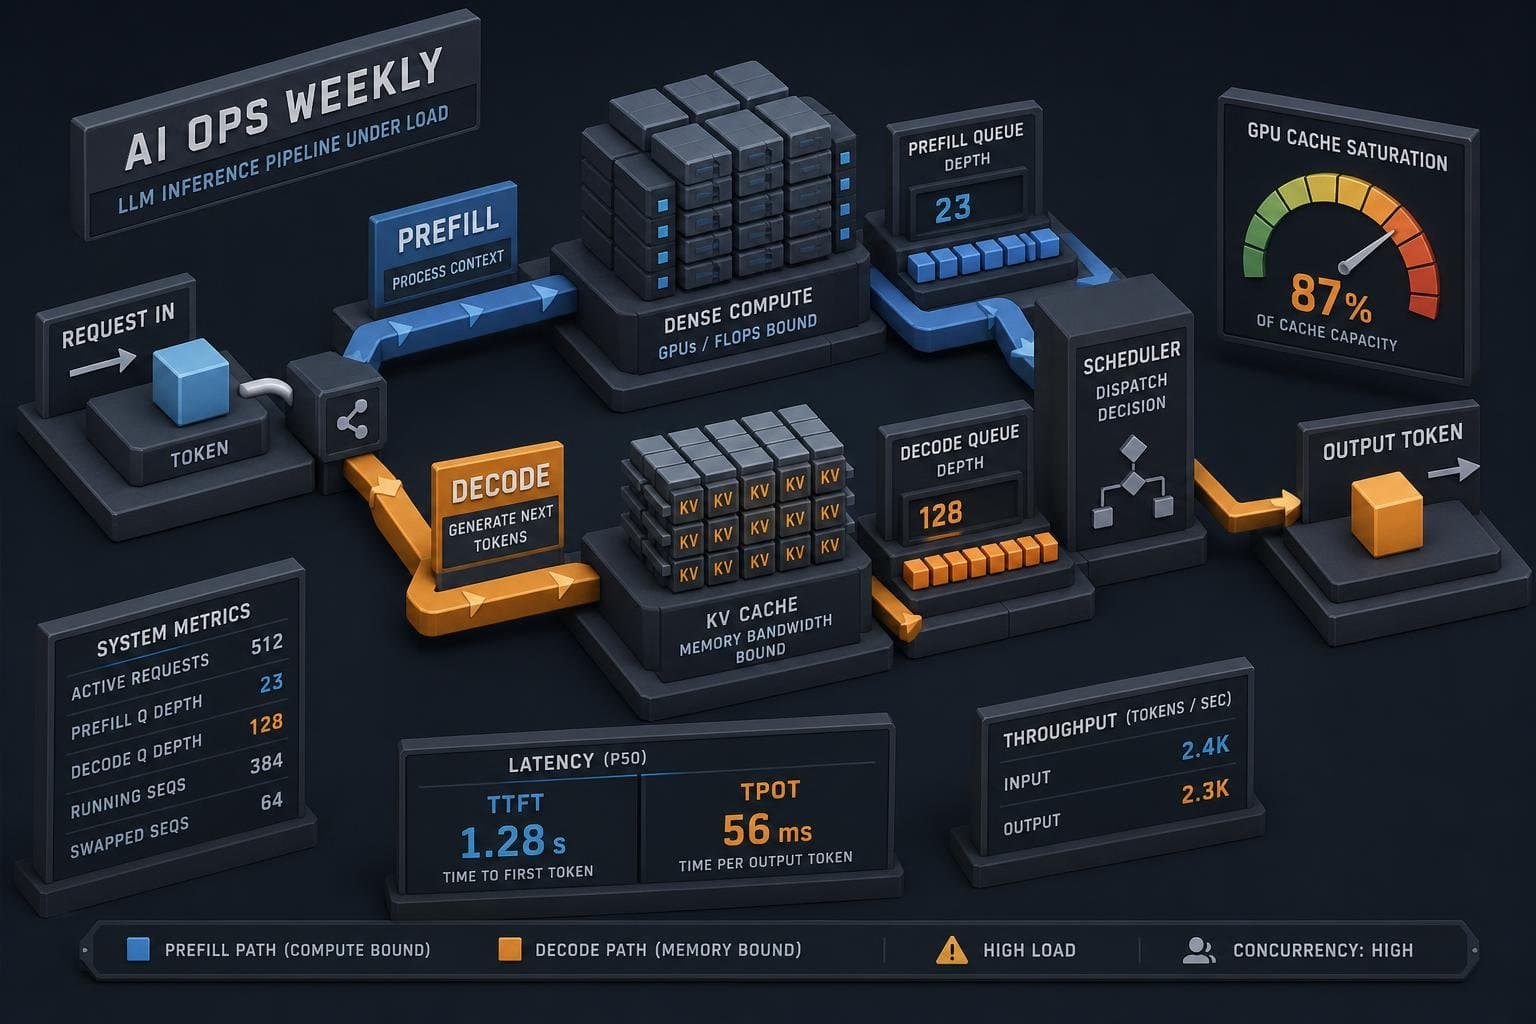
The first thing to understand is that LLM inference has two fundamentally different phases with different bottlenecks, and a single "latency" number collapses them into uselessness.
Prefill is compute-bound. The model processes your entire input prompt in one forward pass, which determines your Time to First Token (TTFT). On a dense 70B model, a 4,000-token prompt might take 400ms to prefill across a tensor-parallel A100 setup — and you can't parallelize this across concurrent requests the same way you can batch decode steps. The only real lever here is raw compute.
Decode is memory-bound. The model generates one token at a time, and each step requires loading the entire KV cache from GPU VRAM. As Baseten's observability guide explains, TPOT (Time per Output Token) measures this phase — high TPOT means text trickles out in stutters instead of flowing. The root cause is almost always memory bandwidth, not FLOPs.
The KV cache is the pressure point connecting both phases. For Llama-3-70B at a 4,096-token context, the memory footprint runs roughly 1.3 GB per request — and that scales linearly with sequence length. When long-context workloads saturate VRAM, you're not hitting a compute ceiling; you're hitting a memory wall. Adding more nodes doesn't fix it.
If your monitoring reports a single end-to-end latency number, you're flying blind. You need TTFT and TPOT tracked separately, because a spike in one requires a completely different response than a spike in the other.
Your Scheduler Is Making a Tradeoff You Didn't Choose
Here's something most teams don't realize until they're deep in an incident: your inference engine's scheduler is actively trading TTFT against TPOT, and the defaults vary wildly between engines.
LeCompute's analysis of vLLM, SGLang, and TensorRT-LLM makes this concrete. vLLM enables chunked prefill by default with a 2,048-token budget per iteration — explicitly optimizing for inter-token latency at the cost of some throughput. SGLang uses 8,192-token chunks, favoring throughput. TensorRT-LLM doesn't enable chunked prefill at all; its default GUARANTEED_NO_EVICT policy prioritizes predictability over either metric.
Same model. Same GPU. Same workload. Three different latency profiles — because three teams made opposite decisions on the same tradeoff, and none of them put a banner in your dashboard explaining what they chose.
When you're chasing a latency spike, the scheduler configuration is a suspect before the model is. A sudden increase in average prompt length can flip you from a regime where chunked prefill helps into one where it's creating queue stalls you didn't anticipate.
Fleet Metrics Tell You Whether. Traces Tell You Where.
This is where most small teams hit a wall. Prometheus metrics and GPU utilization dashboards answer whether the fleet is healthy. They almost never answer the question that dominates incident response: for this specific slow request, where did the time actually go?
The llm-d tracing post frames this precisely: distributed LLM inference breaks classical APM assumptions because KV-cache locality makes pods non-interchangeable, and latency is a function of admission + scoring + prefill/decode coordination + engine phases — not just "service time plus queue." A fleet aggregate cannot reconstruct which scheduling decision caused a slow request after the fact.
The practical implication: you need request-level traces that capture the control-plane decisions, not just HTTP spans. Which pod was selected? What was the cache score? Did the request wait in the decode queue? vLLM's Prometheus endpoint exposes vllm:gpu_cache_usage_perc and queue depth metrics that can surface KV cache pressure in real time — but correlating those fleet signals to a specific slow request requires trace context propagation from the gateway through the scheduler to the engine.
A success rate dropping below 98% is a critical failure state in production vLLM deployments, but the metric alone won't tell you whether the cause is KV cache evictions, scheduler stalls, or prefill contention from a single long-context request starving the queue.
Where to Start When the Spike Hits
When a latency spike lands, work this sequence before touching anything:
- Split TTFT from TPOT. A TTFT spike points to prefill contention or queue depth. A TPOT spike points to memory bandwidth or KV cache pressure. They're different fires.
- Check KV cache utilization. If
gpu_cache_usage_percis climbing toward saturation, you're hitting a memory wall, not a compute wall. Scaling compute won't help. - Review scheduler configuration against your current traffic shape. If average prompt length has shifted, your chunked prefill budget may be mismatched to the workload.
- Correlate fleet metrics to individual request traces. The aggregate tells you the magnitude; the trace tells you the mechanism.
The Redis inference latency guide makes a point worth internalizing: TTFT, TPOT, and end-to-end latency can disagree about which system is "faster" depending on the workload. There's no single number. There's a profile — and debugging latency means understanding which part of that profile broke, not just that something did.
The spike is almost never in the model. It's in the three layers before it.


