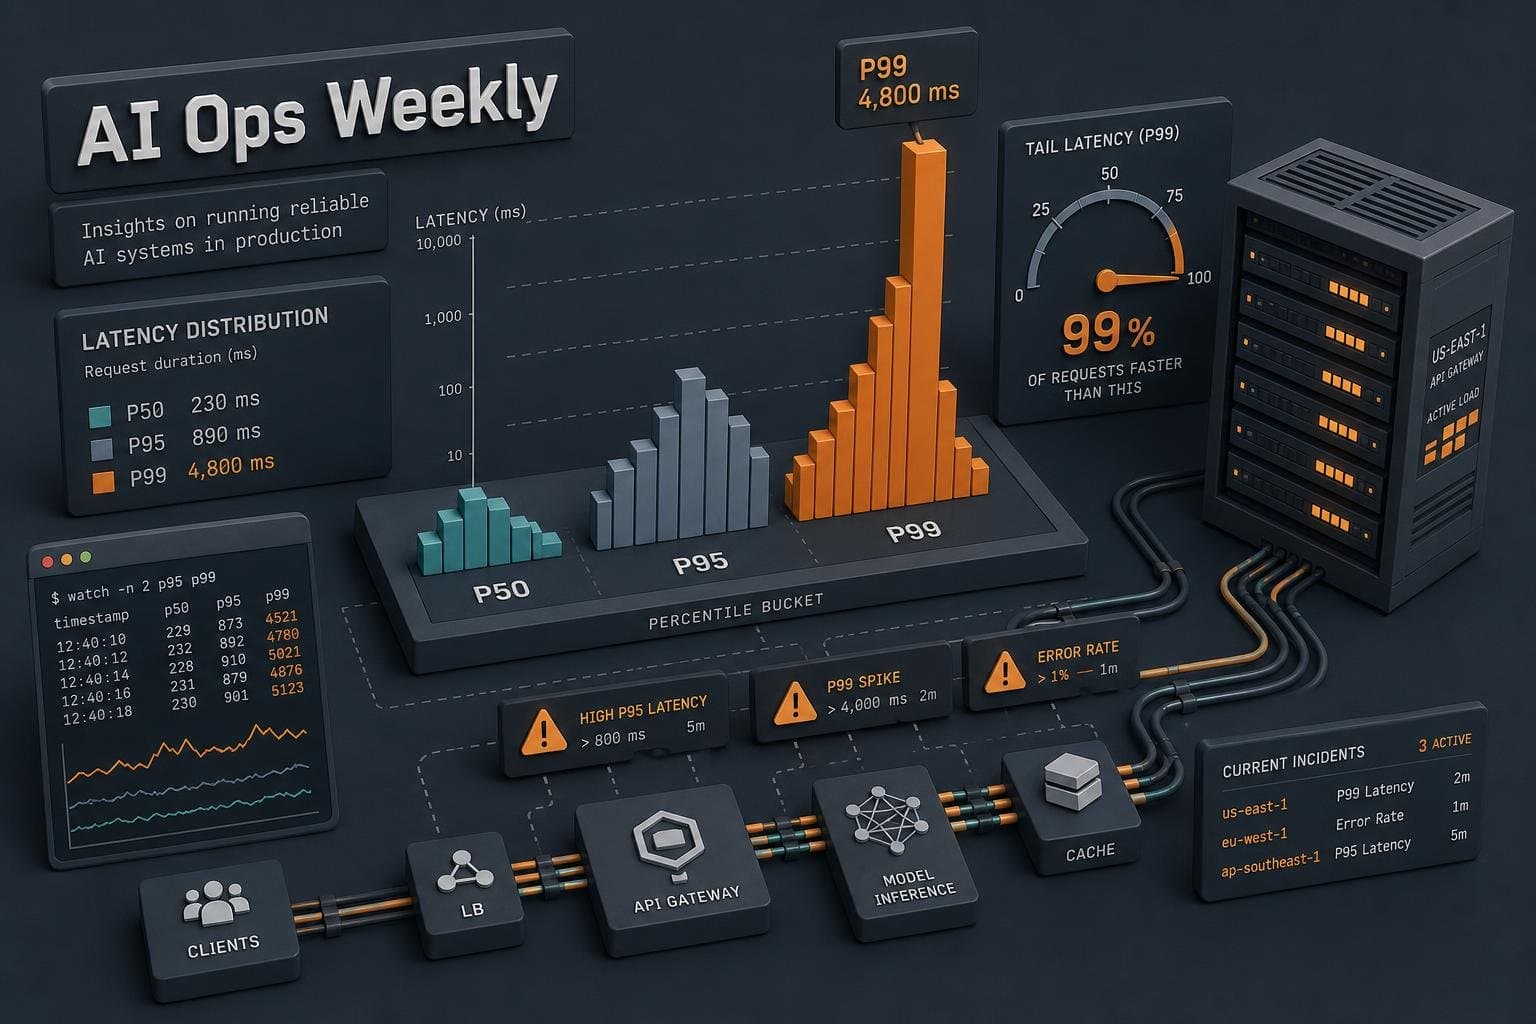

There's a specific failure mode I see constantly in production AI systems: a team sets a latency SLO, hits it consistently on their dashboards, and still gets user complaints about the app feeling broken. The postmortem always reveals the same thing. They were measuring average latency — or at best P50 — while their users were living in the tail.
LLM latency doesn't behave like web API latency. The distribution is wider, the tail is heavier, and the failure modes are different enough that the monitoring instincts you built on traditional services will actively mislead you.
TTFT and Inter-Token Latency Are Two Different SLOs
The first mistake is treating LLM latency as a single number. Brics-econ's observability guide breaks this down clearly: there are two distinct user experiences happening in sequence. Time-to-first-token (TTFT) is the "is it working?" moment — the delay before any text appears. Inter-token latency is the streaming experience after that. Optimizing one doesn't help the other, and conflating them in a single latency metric hides which one is actually hurting you.
The practical thresholds matter here. That same guide puts sub-50ms TTFT as feeling instantaneous and anything above 200ms starting to feel sluggish. Above a few seconds, users assume the app has frozen. These aren't soft guidelines — they're the thresholds around which you should set your SLO targets, not averages.
The model benchmarks back this up with real numbers. Kunal Ganglani's latency benchmark — run from a single Toronto server across five models in March 2026 — found Claude Haiku 4.5 delivering first tokens in 597ms on medium-length prompts, while GPT-4.1 Mini came in around 2,400ms on the same test. That's a 4x gap. Both numbers might look acceptable in a P50 dashboard. Neither tells you what your P99 looks like under load.
The Percentile You Pick Changes What You're Actually Measuring
Spanlens's LLM observability guide recommends tracking latency at P50, P95, and P99, split by model and prompt version. That last part — split by prompt version — is where most small teams fall short. They track aggregate latency across all requests, which means a slow prompt version getting 10% of traffic can be completely invisible in the aggregate numbers.
The reason P99 matters specifically: a P99 spike usually means a hot prompt got long, not that the provider is down. That's a direct quote from the Spanlens guide, and it's a useful diagnostic heuristic. If your P50 is stable and your P99 is climbing, you have a prompt engineering problem, not an infrastructure problem. Those require completely different responses.
Conduktor's SLA guide for streaming systems frames this well for anyone coming from a data infrastructure background: organizations typically commit to targets like "95% of messages processed within 500ms" or "99th percentile latency under 2 seconds." The point is that the percentile is part of the SLO definition, not an afterthought. Writing an SLO as "latency under 1 second" without specifying the percentile isn't an SLO — it's a wish.
The Cost Tradeoff Hiding Inside Your Latency Choice
Here's where it gets operationally uncomfortable. Faster models are cheaper. Ganglani's cost-latency analysis frames this as a decision matrix: Claude Haiku 4.5 is both faster on TTFT and cheaper per token than GPT-4.1 Mini. But "faster and cheaper" doesn't mean it's the right choice for every workload — quality tradeoffs exist, and Grizzly Peak's pricing analysis makes the point bluntly: the cheapest model per token is often the most expensive model per result. Teams that pick a fast, cheap model for a complex extraction task and then burn through retries on 40% failure rates have optimized the wrong metric.
The practical implication: your latency SLO and your cost budget aren't independent variables. If you set a P99 TTFT target of 800ms, you've implicitly constrained your model choices. If you then optimize for cost by routing to a cheaper model that can't hit that target under load, you've broken your SLO without changing your infrastructure. nOps's cost optimization guide recommends model routing as a cost lever — but routing decisions need to be latency-aware, not just price-aware.
What to Actually Instrument
The minimum viable setup for a small team: track TTFT and total response time as separate histograms, not a single latency metric. Set P95 and P99 SLO targets for each, segmented by prompt version. Alert on P99 divergence from P95 — that gap widening is your earliest signal of tail behavior emerging. DevopsRoles's MLOps observability guide recommends OpenTelemetry instrumentation with custom span attributes capturing token-level latency, which gives you the granularity to actually diagnose what's happening rather than just knowing something is wrong.
The dashboard that shows green average latency while your P99 is degrading isn't a monitoring system. It's a false sense of security with a nice color scheme. Build the SLO around the number your worst-case users are experiencing — then work backward to understand why.


