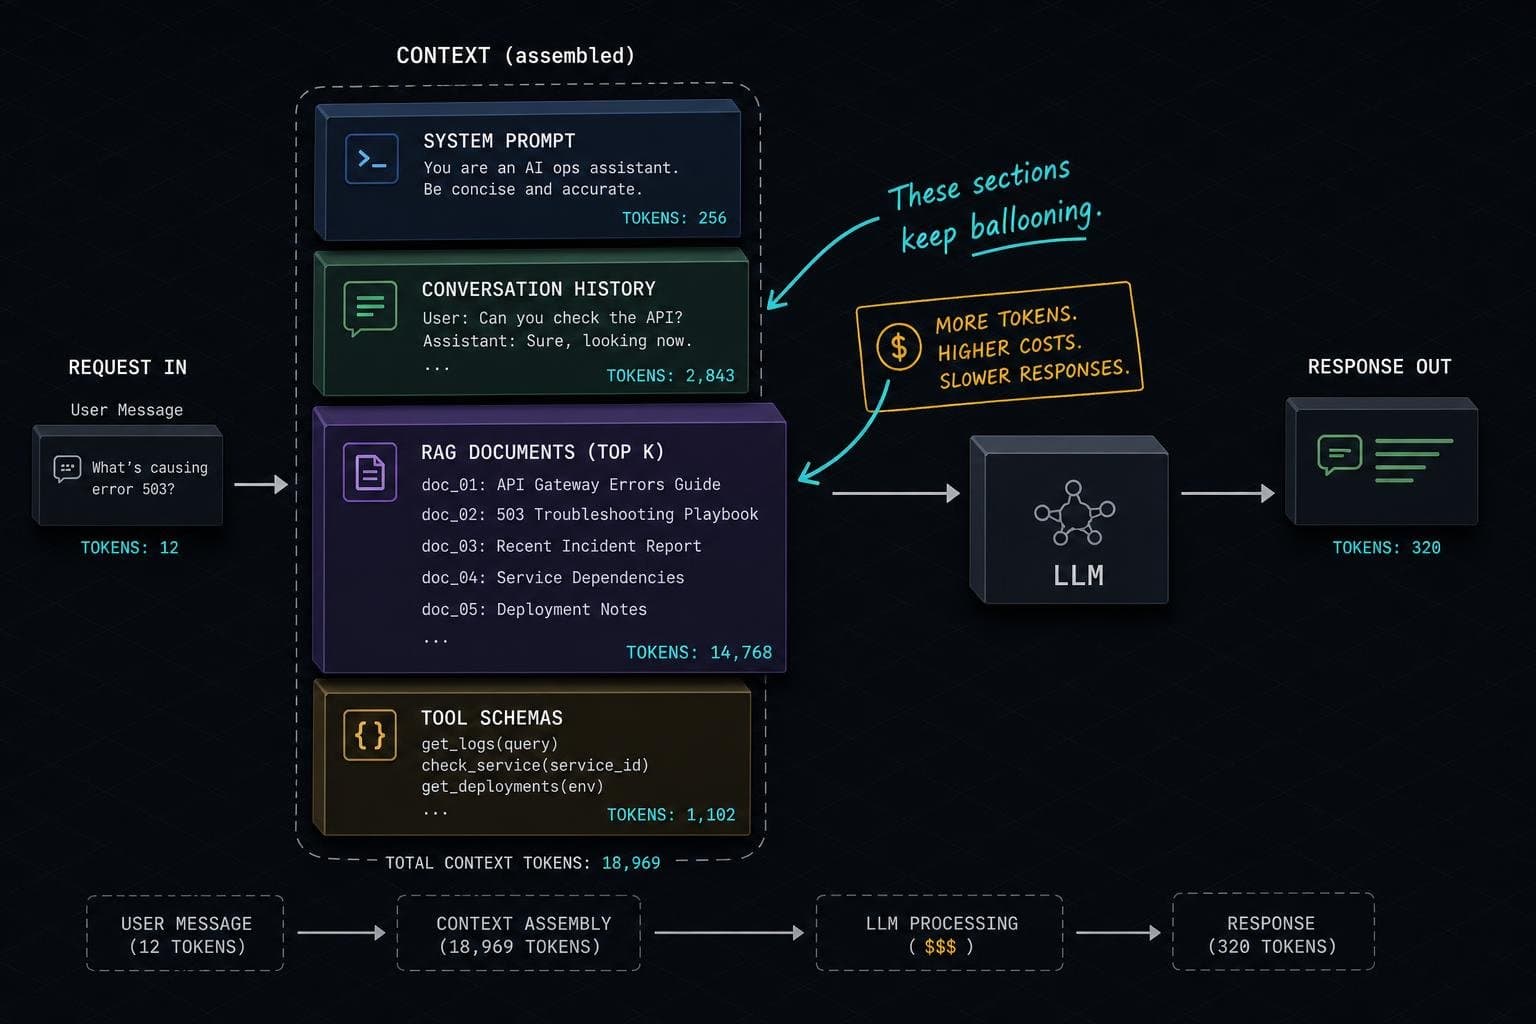

The Monday morning bill shock is a rite of passage. You shipped the feature Friday, traffic came in over the weekend, and now you're staring at a number that's 3–5× what your back-of-napkin estimate said it should be. The instinct is to blame the model pricing. The real culprit is almost always that you never actually measured what you were sending.
Most teams treat token counting as a post-hoc billing exercise — something you do after the invoice arrives. That's backwards. By the time the bill lands, you've already paid for every inefficiency in your architecture.
The 96% You're Not Thinking About
Here's the uncomfortable truth about prompt optimization: the user's actual message is usually a tiny fraction of what you're sending to the API. According to one production engineering breakdown, the user message often represents roughly 4% of total context — the other 96% is system prompt, conversation history, retrieved RAG documents, and tool/function schemas.
This means the classic advice — "write shorter prompts" — is optimizing the wrong thing. You can trim your system prompt by 20% and barely move the needle. Meanwhile, your RAG pipeline is stuffing 8,000 tokens of retrieved context into every request regardless of whether the query needed it, and your conversation history is growing unbounded because nobody implemented a truncation strategy.
The real question, as that same engineering post frames it, is: what's in your context that doesn't need to be there? That's a different problem than "how do I write a shorter prompt," and it requires measurement before it requires optimization.
Count Before You Send, Not After
Every provider returns token usage in the API response. Most teams log it. Far fewer teams count tokens before the request goes out — which is the only way to catch runaway context before you've already paid for it.
The Anthropic API, for instance, exposes a countTokens method that lets you measure a full request — system prompt, conversation history, and all — before committing to the call. A practical token budgeting guide from DEV Community recommends running this instrumentation for 48 hours before touching anything else. The distribution of token counts across real traffic will tell you exactly which component of your context is the actual cost driver.
The agentic case is worse. Prediction Guard's monitoring guide makes the point bluntly: autonomous coding agents and recursive tool-calling loops can exhaust token budgets overnight, with vendor dashboards reflecting the damage only after the fact — because streaming completions hide usage data by default unless you set explicit flags. You need system-level tracking, not dashboard-watching.
This is the distinction that matters: monitoring token usage reactively (reading the response's usage field) tells you what happened. Counting tokens proactively (before the call) and enforcing budget limits at runtime tells you what's about to happen and gives you a chance to intervene.
The Observability Layer That Actually Helps
Once you're instrumenting at the span level, you need somewhere to route that data that isn't just a spreadsheet. The Firecrawl overview of LLM observability tools points to Helicone and Portkey as the fastest paths to cost-control visibility — both operate as gateway layers that intercept requests and give you per-call token breakdowns without requiring you to instrument every call site manually. For teams already running Datadog, the Crest Data guide on agent observability notes that Datadog's State of AI Engineering 2026 report found token usage per LLM request more than doubled for median organizations year over year, and quadrupled for the heaviest users — which means whatever your baseline is today, plan for it to grow.
The Prediction Guard guide draws a useful architectural distinction: token consumption telemetry routes to your engineering observability layer (Datadog, Honeycomb, whatever you're using), while policy violations and enforcement events route to your security layer as separate signals. Two destinations, two teams, two different response playbooks. Most teams conflate these and end up with neither working well.
What to Actually Instrument This Week
If you're not counting tokens before calls, start there. Wrap your API calls to log input tokens, output tokens, cache hits, and estimated cost per request. Run it for 48 hours. Look at the p95 and p99 of your input token distribution — not the average. Averages hide the long tail of requests where your context exploded.
Then look at what's in those expensive requests. Nine times out of ten, it's unbounded conversation history or over-retrieved RAG context. Fix those two things and you'll move the number more than any model swap would.
The model is rarely the problem. The architecture is almost always the problem. You just can't see it until you measure it first.


