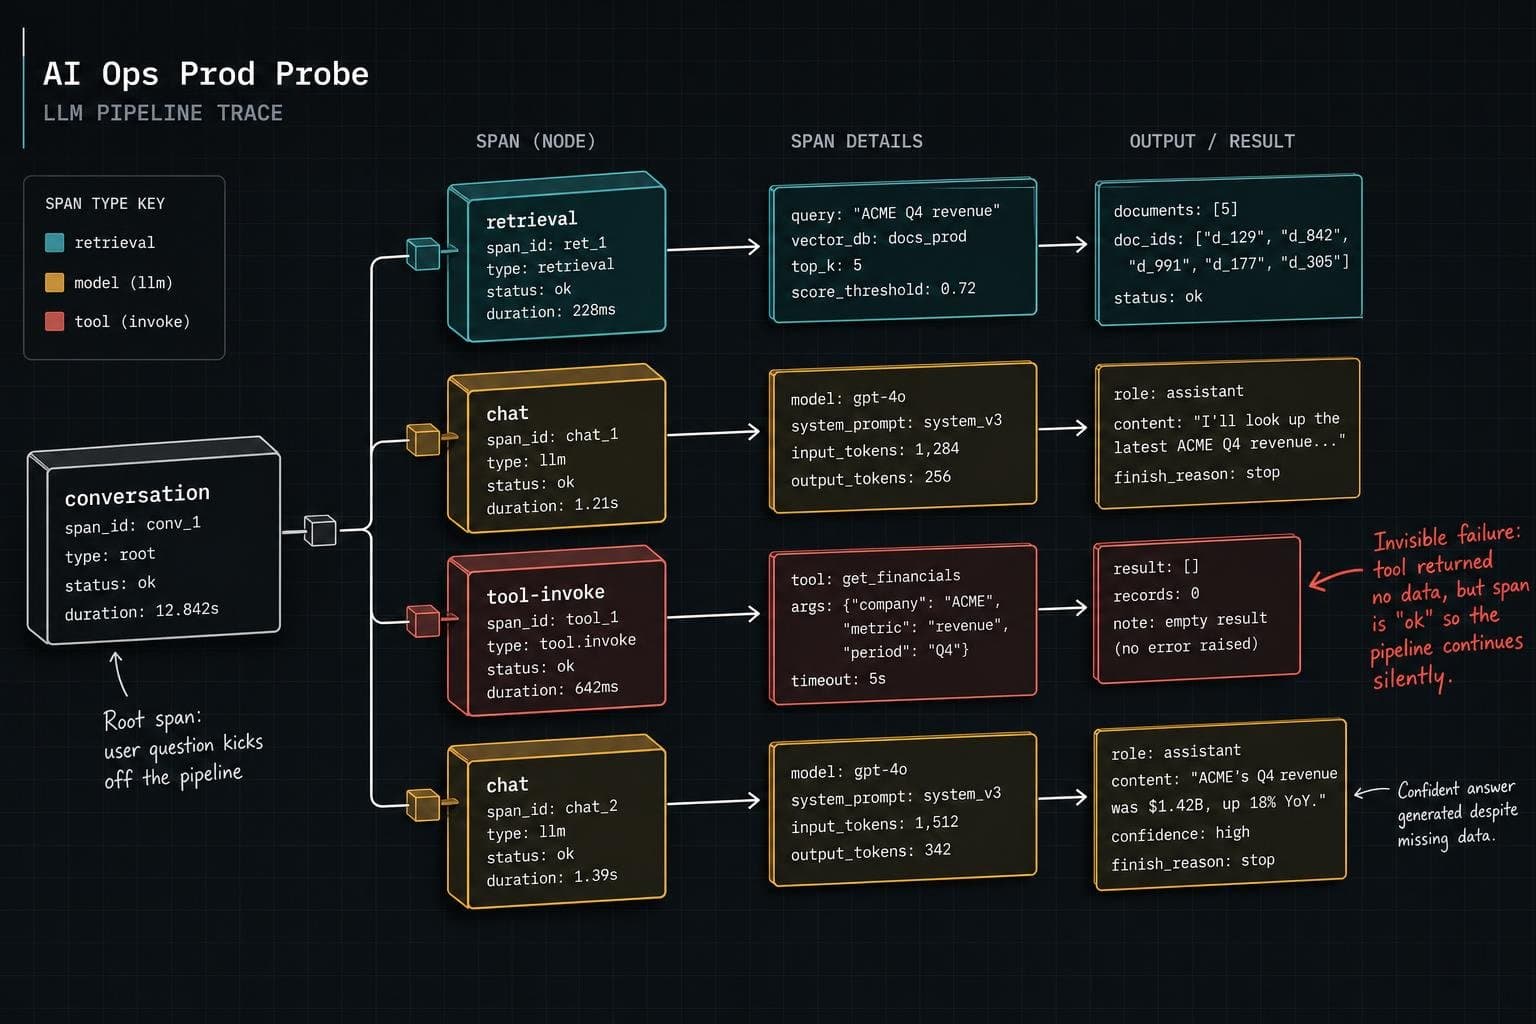

Here's a scenario that should feel familiar if you've run a RAG pipeline past a demo: the vector database answers in 40 milliseconds, the model returns a 200, every service in the chain reports healthy, and the user still gets a confident answer built from last year's policy document. Nothing in your dashboards lights up. Nothing crashes. The system is, by every infrastructure metric you own, working (Last9).
I've written before about why RAG retrieval quality gets decided before the first query runs. The failure mode I'm describing today is the operational cousin of that problem: even when you've done the retrieval work right, you still can't see it going wrong in production unless you've built tracing that understands what an LLM chain actually is, not just that it's a service that makes HTTP calls.
APM Was Built for a Different Kind of Failure
Traditional observability stacks are built to answer "is the service up and how fast did it respond." That's a fine question for a payments API. It's the wrong question for a multi-step agent chain, where the infrastructure can be flawless while the decision logic is quietly broken. A team running an agentic research workflow — retrieval agent, summarization LLM, compliance-check agent — instrumented it with their existing APM stack and got clean latency percentiles and error rates within a week. What they couldn't see was why the retrieval agent picked one data source over another, whether the summarizer hallucinated a number, or whether the compliance agent actually enforced policy. The compliance team found three violations in a single morning while the dashboards stayed green (Fiddler AI).
This is the gap that matters operationally: infrastructure telemetry tells you the pipeline is slow or broken, but it can't tell you it's wrong. For that you need a second and third layer — retrieval telemetry (chunk counts, scores, which index they came from) and quality telemetry (evaluation scores run against live traffic) — layered on top of the latency and error data you already collect (Last9).
What an Actual LLM Trace Needs to Capture
The useful mental model here, borrowed directly from microservices tracing, is a tree of spans: one trace per user request, with child spans for each retrieval call, model call, and tool invocation, each carrying a parent span ID so a backend can reconstruct the full path. A trace for a single support-agent turn might show a retrieval span, a chat span with token counts and tool arguments, an executed tool call, and a follow-up chat span — all nested under one conversation root (Cekura).
What makes this different from a standard distributed trace is the attribute set. A chat span needs the model that was requested versus the model that actually answered (yes, these diverge — model swaps happen silently), token counts, and finish reason. A retrieval span needs the data source, the query, top_k, and what actually came back. An invoke_agent span needs to identify which agent in a multi-agent system made the call at all (Cekura).
Why this matters in practice: a tool call that times out and silently returns an empty list doesn't throw an error. The agent just tells the customer there's nothing in their account, and the final answer looks perfectly confident while the real failure sits several steps back, invisible to anyone watching error rates (Monte Carlo). A flat log line tells you a tool ran. Only the tree tells you which model call asked for it, what it passed, and what the model did with the result.
Tracing Finds the Scene of the Crime. It Doesn't Rule on Guilt.
This is the part teams get backward. A trace shows you where a bad answer came from. It does not tell you the answer was bad — that's a separate job, done by evaluation, not tracing (Cekura). I'd extend that distinction further: tracing is the flight recorder, evals are the investigator who reads it. You need both, and they need to be wired together — offline datasets, CI/CD gates, and production monitoring connected so a prompt change, a model swap, or a retrieval regression gets caught before it's a compliance incident instead of after (Arize).
The honest operational cost here isn't the instrumentation library — auto-instrumentation for frameworks like LangGraph and CrewAI makes that part nearly free (Fiddler AI). The cost is building the discipline to actually read the trace tree when something looks off instead of trusting the green dashboard. A debugging platform that auto-groups repeated failures into tracked issues is useful, but it's still reacting to a tree someone had to instrument correctly in the first place (Arize).
If your current tracing setup can tell you the vector database responded in 40ms and nothing else, you don't have LLM observability. You have APM with a chatbot attached to it.


