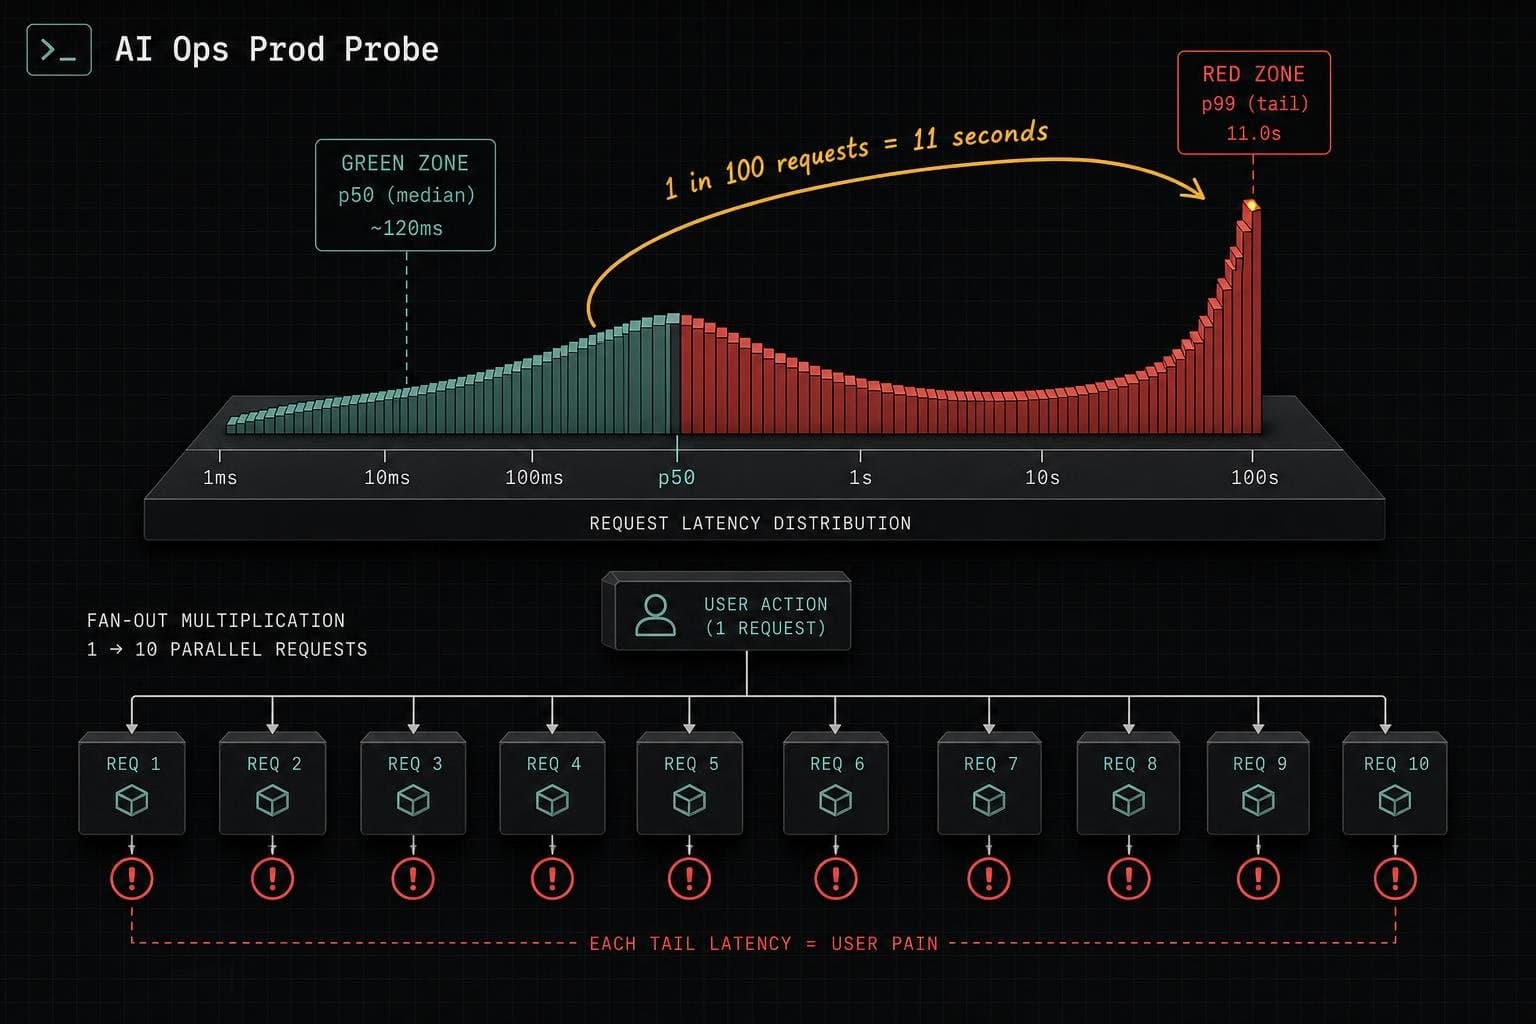

A team runs their LLM feature for a full quarter. The dashboard stays green — p50 latency at 1.9 seconds against a 2.5-second target. Then someone actually looks at churn data and the support queue. As one engineering post-mortem describes it, their p99 was sitting at 11 seconds the entire time. One in a hundred requests took eleven seconds. The median was fine. The tail was a disaster.
That's the trap. And if you're running an LLM feature with a p50 SLO, you're probably in it.
The Math That Makes Tail Latency Worse Than You Think
Here's the compounding problem that most teams don't internalize until it's too late. If a user makes 10 requests in a session and each has a 1% chance of hitting a p99 response, the probability that their session contains at least one slow request is roughly 9.6% — not 1%. The post-mortem above traces this directly to the Dean and Barroso "tail at scale" argument from distributed systems: fan-out multiplies tail exposure, and LLM apps fan out more per user action than a typical web request.
The same math shows up in microservices observability work. Uptrace's analysis of p99 monitoring failures puts it plainly: at 100 requests per second, a p99 of 280ms means one user per second getting a slow response — 3,600 people every hour. That's before you account for fan-out.
LLM apps make this worse in three specific ways. First, response latency scales with output token count — a request generating 800 tokens takes far longer than one generating 80, so the distribution has a long right tail by construction. Second, retries and fallbacks land squarely in the tail and correlate with load, so the tail fattens exactly when traffic is highest. Third, the rarely-hit paths — long-context requests, unusual tool calls — are both slower and rarer, which means they never move the median and always live in p99. All three of these dynamics are structural features of LLM workloads, not edge cases.
What You're Actually Measuring (And What You're Missing)
I wrote about TTFT as the latency number that matters at 2am earlier this year. The argument there was about which metric to watch. The argument here is about how to watch it.
LLM latency decomposes into four components: time to first token (TTFT), time per output token (TPOT), tokens per second, and end-to-end latency. ClickHouse's engineering documentation is explicit that these metrics only make sense as percentiles over raw request events — never as averages. The OpenTelemetry GenAI semantic conventions define gen_ai.server.time_to_first_token and gen_ai.server.time_per_output_token as histogram metrics precisely because the realistic range spans four orders of magnitude.
The other thing that kills you is global aggregation. Uptrace's breakdown makes the point that a single dashboard metric buries signal under noise — your /api/checkout might have a p99 of 2.1 seconds while a health check endpoint pulls the overall number down to something that looks fine. The team in the post-mortem above discovered this the hard way: their global p99 hid that one long-context summarization endpoint had a p99 of 24 seconds while everything else was single-digit.
The fix is percentiles per route, not global percentiles. And KDnuggets' production guide adds queue time and cache hit rate to the required measurement set — because a high TTFT might point to long prompts, slow retrieval, or queueing, and you can't tell which without tracking them separately.
Setting SLOs That Actually Reflect User Experience
The practical question is: what do you actually alert on?
Stop using p50 as your primary SLO target. It promises nothing about the other half of your requests. Track p95 and p99, and alert on them. The p50 tells you the common case is fine; the p99 tells you how bad the bad case is. You need both, and you need them per route.
Datadog's State of AI Engineering report notes that teams managing model fleets are dealing with routing, lifecycle management, and debugging across distributed systems — and that model, prompt, or retrieval changes can move latency without an obvious code change. That's the environment your SLOs need to survive in. A global p50 target won't catch a prompt change that blows up tail latency on one endpoint.
The production reality, confirmed by LeadDev's analysis of inference framework evaluation, is that synthetic benchmarks use fixed prompt lengths and steady request rates — exactly the conditions that hide tail behavior. Real traffic is bursty and variable. Your SLOs need to be set against that reality, not against the clean conditions that made your benchmark numbers look good.
Set your SLO on p95 TTFT, segmented by route. Alert when it degrades. The p50 can stay on the dashboard as context — but if it's the number you're accountable to, you're accountable to the wrong half of your users.


