The invoice arrives and the number is wrong — not wrong as in fraudulent, wrong as in useless. It tells you what you spent across the whole month. It doesn't tell you that one agent workflow running in your CI/CD pipeline burned 40% of that budget across three days because a ReAct loop was appending every tool result back into the context window before each reasoning step.
That's the core problem with token budgeting in multi-model applications: the billing unit (the monthly invoice) and the debugging unit (the individual span) are separated by several layers of abstraction, and most teams never close that gap.
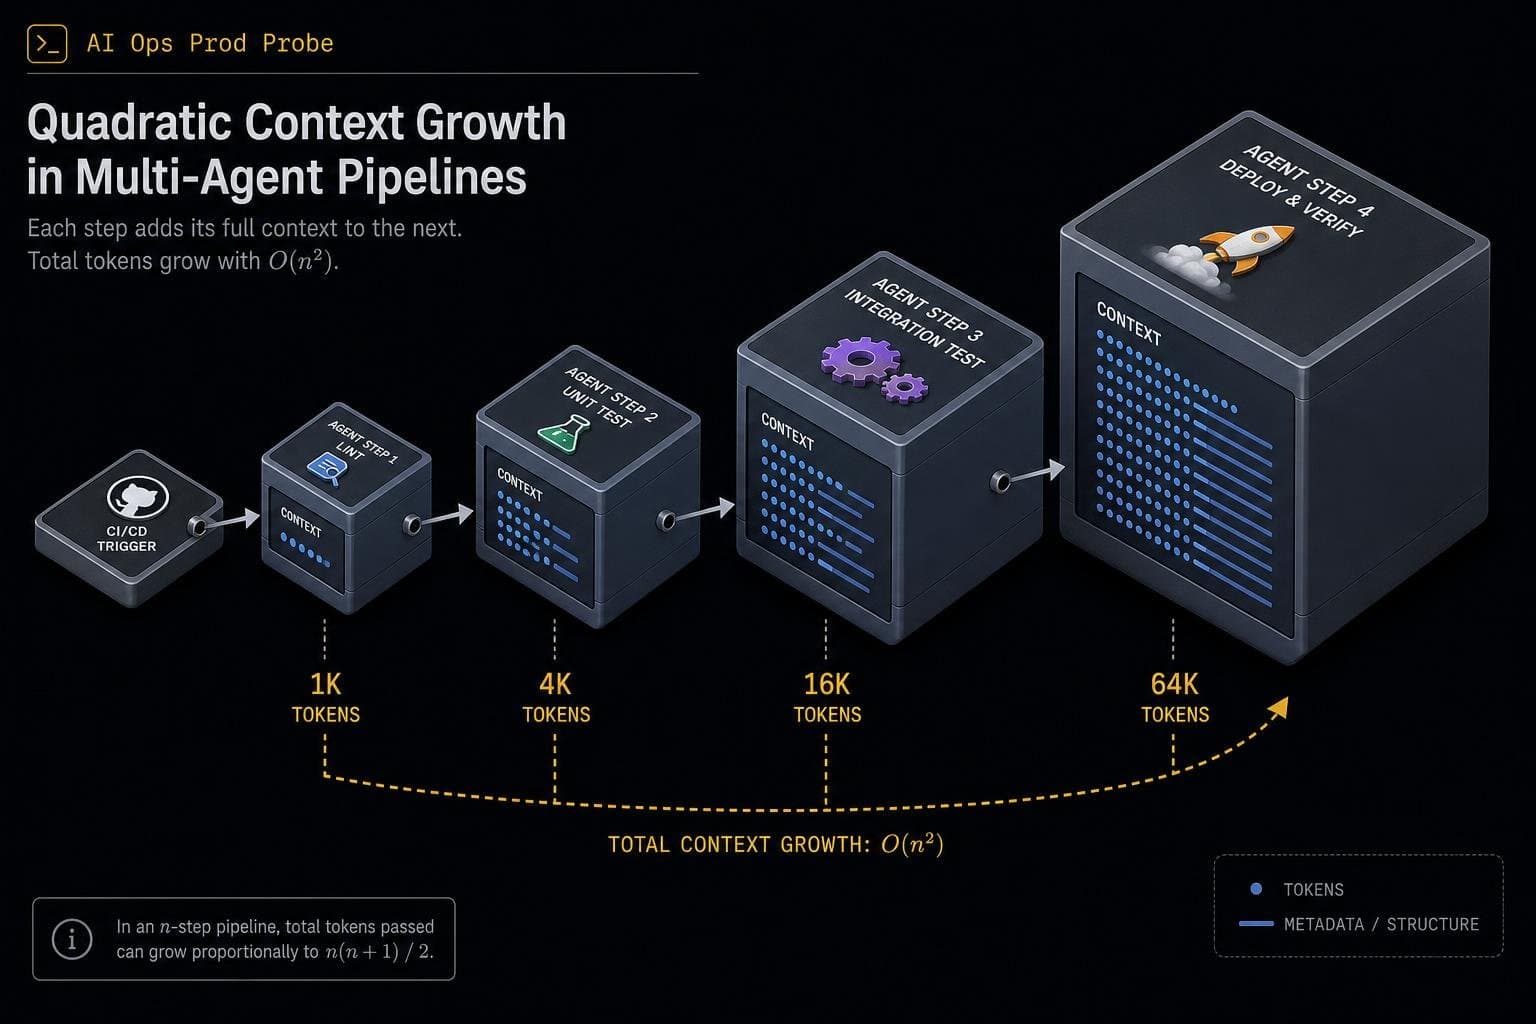
The O(n²) Problem Nobody Budgets For
Here's the failure mode I see most often. A team ships an agent, instruments it lightly, watches the aggregate cost dashboard, and concludes everything is fine. Then one month the bill doubles.
The culprit is almost always context growth in agentic loops. As TrueFoundry explains, agentic frameworks like ReAct append every action's result back into the context window before the next reasoning step — meaning token consumption per agent run grows roughly O(n²) in the number of steps. An agent that takes 10 steps doesn't cost 10x a single-step call; it costs closer to 55x, because each step carries the full history of everything before it.
Now add CI/CD automation. Interactive sessions have a natural pacing mechanism: the human reading the output. Automated pipelines don't. TrueFoundry notes that an agent configured for automated PR review can be triggered hundreds of times an hour by ordinary commit traffic, with nothing in its environment to slow it down. The math compounds fast. Your aggregate dashboard shows a smooth upward trend. The actual cause — three agents in a loop, triggered by a noisy branch — is invisible until you look at span-level traces.
Aggregate Dashboards Are the Wrong Unit of Analysis
The instinct when costs spike is to open the billing dashboard and look for the big number. That's the wrong tool. Aggregate dashboards show the total bill; they don't identify which prompt, feature, workflow step, or model choice is responsible.
What you actually need is request-level detail across three layers: token counts and estimated cost attached to each LLM call, span-level tracing that captures tool calls and retrieval steps, and tag-based grouping that breaks spend down by user, feature, model, or environment. Braintrust's production cost tracking guide makes the point directly: many tools capture basic LLM call data, but fewer clearly expose tool-call and retrieval costs, and only a smaller group connects cost findings to prompt, model, and release decisions.
The retrieval step is where teams consistently undercount. A RAG pipeline that pulls oversized context across repeated calls doesn't show up as expensive on a per-call basis — it shows up as a slow accumulation that's hard to attribute without trace-level visibility.
Honeycomb's Agent Timeline takes this seriously at the UI level: clicking into any span surfaces LLM operations, tool calls, token usage, and prompt details, with the full trace waterfall showing API calls, database queries, and infrastructure behavior together. The point isn't the specific tool — it's the architecture. Token visibility needs to live at the span level, not the session level, and definitely not the monthly invoice level.
Budget Enforcement Belongs at the Gateway, Not the Dashboard
Visibility is necessary but not sufficient. You can watch costs climb in real time and still have no mechanism to stop them. The actual control point is the gateway — the only place where a request can be tagged at ingest, priced at egress, and stopped at the threshold between the two.
TrueFoundry frames this cleanly: visibility without control is just accounting; control without attribution is just blanket bans. The interesting engineering happens at the gateway. That means per-workflow token budgets that fire before the invoice, not after — and it means those budgets need to be set from real trace data, not guesses.
The Redis token optimization guide adds the latency dimension: output tokens are generated sequentially during the decode step, which is often memory-bandwidth-bound, so output length dominates perceived latency as much as it dominates cost. Budget enforcement that only targets input tokens misses half the problem.
MLflow's observability pipeline documentation reinforces the architectural point: LLM applications require tracing across prompt construction, model inference, retrieval steps, tool calls, and evaluation scoring — not just the model call itself. Traditional application logs give you almost nothing useful when an agent burns through token budgets without explanation.
What to Actually Instrument
The practical checklist, derived from what the failure modes actually look like:
- Tag every span with workflow identity — feature, environment, model, user segment. Without tags, you can't break down spend by anything meaningful.
- Measure context window growth across agent steps — not just per-call token counts. If your agent's average context size is growing run-over-run, you have a compounding cost problem that's invisible in aggregate.
- Set budget thresholds at the workflow level, not the account level — and make them fire in real time, not at invoice time.
- Audit retrieval chunk sizes separately — oversized context from RAG is one of the most common hidden cost drivers and rarely shows up in model-level dashboards.
The teams that get surprised by LLM bills aren't failing at budgeting. They're failing at instrumentation. Fix the observability layer first, and the budget numbers become something you can actually act on.


