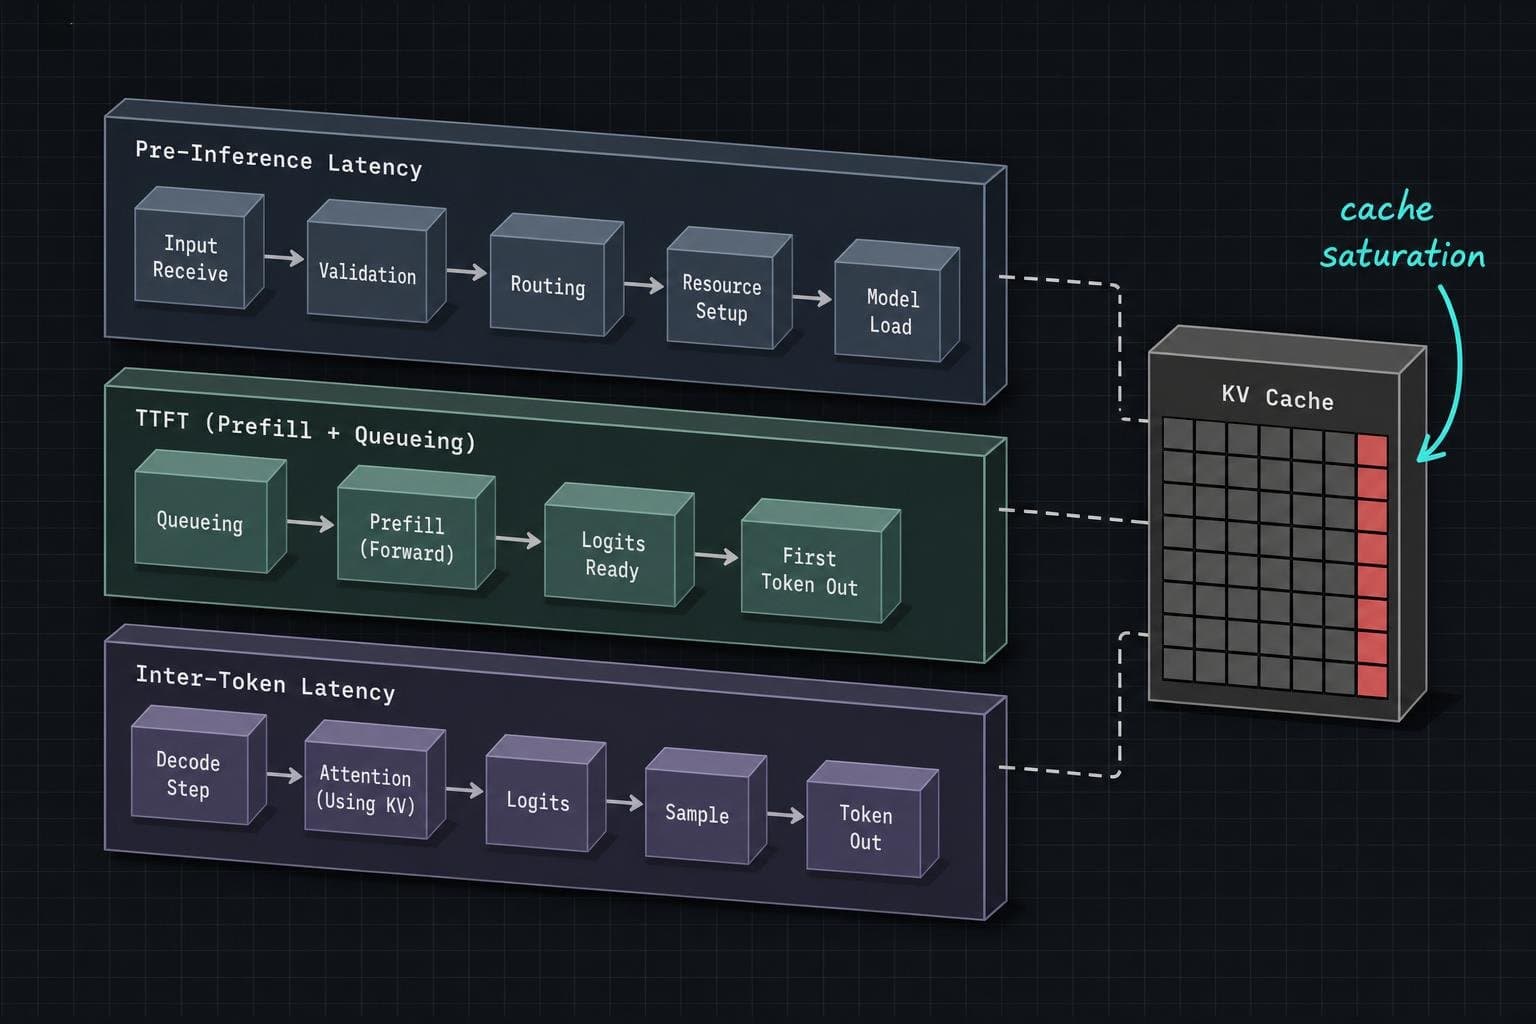

You've instrumented TTFT. You're tracking it at p99. You've even read the post I wrote about why p99 TTFT is the number that saves you at 2am. Good. Now here's the uncomfortable follow-up: TTFT tells you when the model started responding. It doesn't tell you why it was slow, or which layer of your stack is responsible.
Most teams treat latency as a single number. It's three different problems wearing the same label.
Prefill and Decode Are Not the Same Bottleneck
LLM inference has two mechanically distinct phases, and they fail in different ways for different reasons.
Prefill is compute-bound. The model processes your entire input prompt in one forward pass — this is what determines your TTFT. On a dense 70B model, a 4,000-token prompt might take 400ms to prefill across a tensor-parallel A100 setup. You can't parallelize prefill across concurrent requests the same way you can batch decode steps. The only real lever is raw compute — or shorter prompts.
Decode is memory-bound. The model generates one token at a time, and each step requires loading the entire KV cache from GPU VRAM. VRAM bandwidth almost entirely determines inter-token latency, not FLOPs — which is why two GPUs with similar compute specs can produce dramatically different streaming speeds on long-form generation.
The practical implication: if your TTFT is fine but users are complaining that responses feel slow, you have a decode problem, not a prefill problem. These require different fixes. Throwing more compute at a memory-bandwidth bottleneck is expensive and mostly useless.
TTFT measures how long you wait before anything appears; tokens per second measures how quickly the response continues once it starts. A system can be strong on one and weak on the other. If you're only tracking TTFT, you're flying half-blind.
The KV Cache Is Where Latency Hides
The KV cache is the pressure point that most monitoring setups ignore until it's too late. For every token in a sequence, attention layers store key and value tensors. The memory footprint follows the formula: num_layers × 2 × num_kv_heads × head_dim × seq_len × dtype_bytes — and it scales linearly with sequence length. Long-context workloads saturate VRAM before FLOPs become the bottleneck.
What this means in production: your latency isn't just a function of the model and the prompt. It's a function of how many concurrent requests are competing for KV cache space. A request that runs fine at 10 concurrent users can spike badly at 50, not because the model changed, but because cache pressure increased and requests started queuing.
If you're running vLLM, the metrics endpoint exposes vllm:gpu_cache_usage_perc and vllm:num_requests_waiting — and Prometheus can scrape both. If you're not watching cache utilization alongside TTFT, you're missing the leading indicator. By the time TTFT spikes, the cache has already been saturated for a while.
API Latency Benchmarks Are a Starting Point, Not a Destination
For teams using managed APIs rather than self-hosted inference, the bottleneck analysis shifts — but the multi-layer problem doesn't go away.
Real benchmark data from mid-2026 testing shows Claude Haiku 4.5 delivering its first token in 597 milliseconds on a medium-length prompt, while GPT-4.1 Mini took roughly 2,400ms on the identical test — a 4x gap that's the difference between an app that feels alive and one that feels broken. These numbers matter. But they were measured from a single server, in a single region, in a controlled window. Your production traffic doesn't look like that.
What vendor benchmarks and independent tests both miss: queueing time at the API layer. TTFT captures request queueing time, prompt processing (prefill), and network or routing delay — all bundled together. When you see a TTFT spike on a managed API, you don't know which component degraded. Was it the provider's inference cluster under load? A routing change? A network hiccup between your server and their endpoint?
The answer is to instrument at the span level: measure the time from when your code fires the request to when the first byte returns, separately from the time your code spends constructing the prompt and any post-processing you do on the response. If you're not separating those spans, a slow prompt-construction step (a database lookup, a retrieval call, a template render) will contaminate your TTFT numbers and make the model look slower than it is.
Tokens per second benchmarks also change dramatically under concurrency — a single-user number tells you almost nothing about how the system behaves when your feature actually gets used.
What to Actually Instrument
Three metrics, tracked separately, at p99:
- Pre-inference latency — time from user action to API call. This is your code's fault, not the model's.
- TTFT — time from API call to first token. This is prefill plus queueing plus network.
- Inter-token latency — time between tokens during streaming. This is decode speed, and it's where memory bandwidth constraints show up.
Most teams track only TTFT and call it "model latency." That's like measuring only the time to the first bite of a meal and calling it restaurant speed. The other two numbers are where the real operational surprises live — and they require different fixes when they go wrong.


