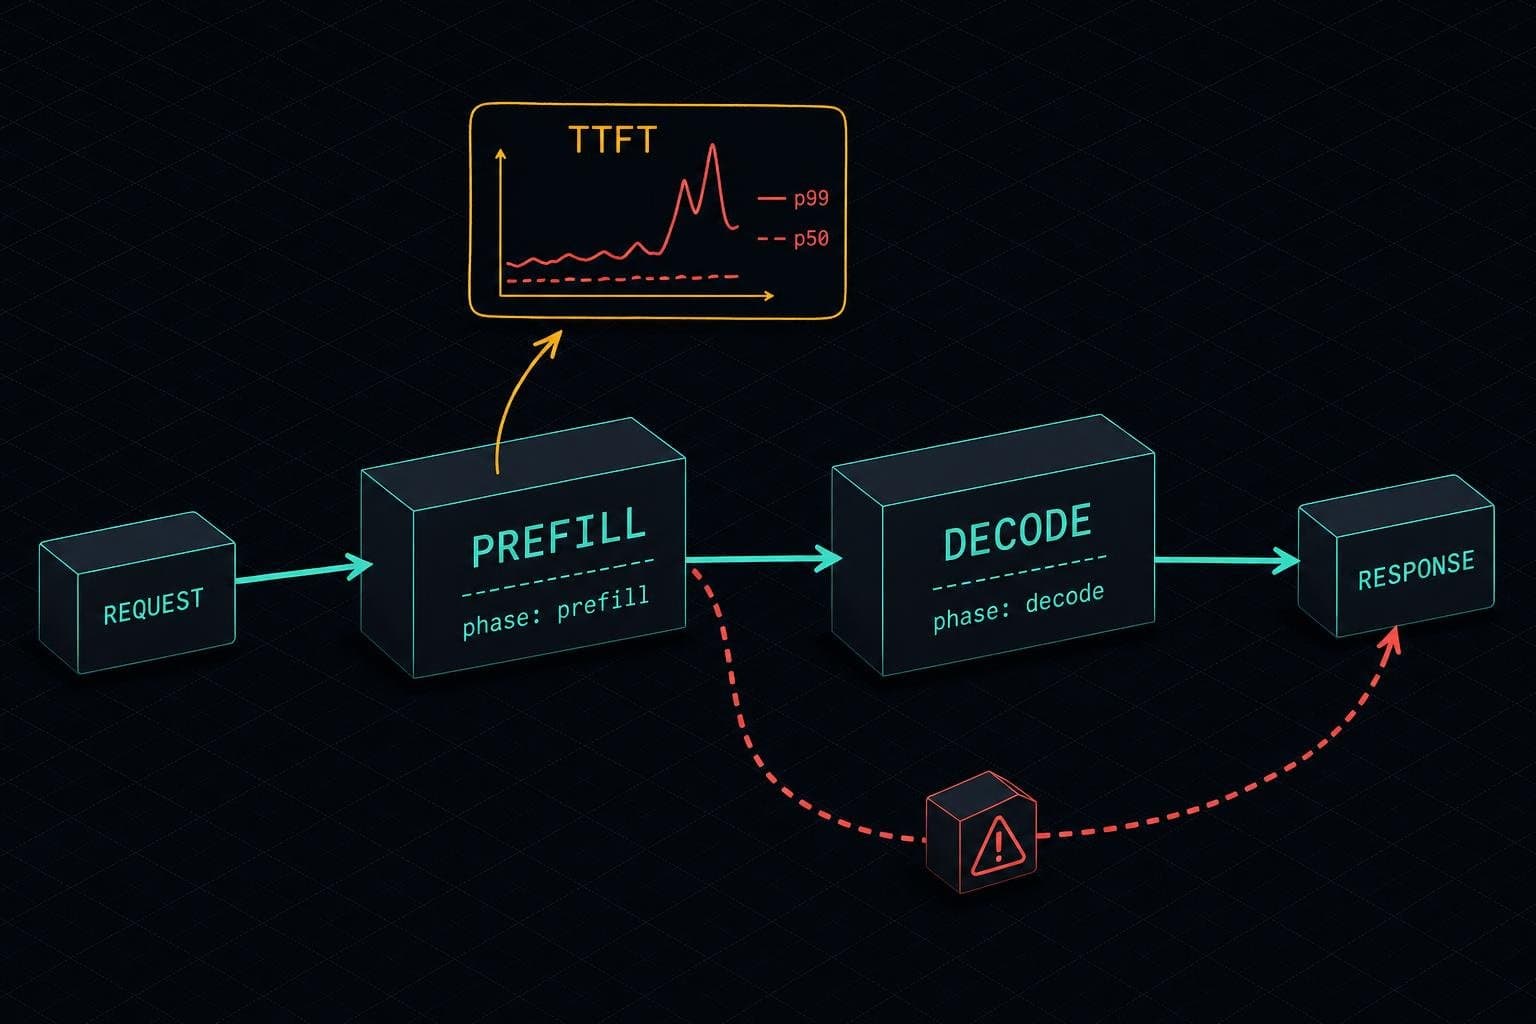

Four seconds. That's how long a user stares at a blank screen before they decide your AI feature is broken. Not slow — broken. They don't know about prefill phases or KV cache transfer. They know the cursor is blinking and nothing is happening.
Most teams are measuring the wrong thing, and they won't find out until the support tickets arrive.
"Latency" Is Three Different Numbers
The core problem is definitional. As General Compute's inference guide lays out, total request latency decomposes cleanly into two distinct phases: prefill (where the model ingests your prompt and builds its internal state) and decode (where it generates tokens one at a time). The formula is straightforward:
total_latency = TTFT + (output_tokens - 1) / TPS
These two phases respond to completely different failure modes and optimizations. Emre Cavunt's observability breakdown puts it plainly: high TTFT is usually a prompt problem or a queue problem. High end-to-end latency is usually a model size or hardware problem. If you're tuning the wrong thing, you'll ship improvements your users never notice.
The SwirlAI newsletter's monitoring piece makes the same point from a different angle: an LLM system breaks the assumptions web monitoring was built on. Your API gateway emits uptime, error rates, and latency percentiles — and none of those numbers can tell you that users are staring at a blank screen for four seconds before the first token appears. A quality regression doesn't throw a 500. It returns confident text with a 200 status code. Latency regressions are subtler: your p50 looks fine while your p99 is quietly destroying user experience for a meaningful slice of your traffic.
This is why TTFT — specifically p99 TTFT — is the metric that actually matters for interactive AI features. Not average TTFT. Not p50. The tail.
The Tail Is Where Production Lives
Here's the thing about percentiles that teams consistently underweight: your p50 is what happens when everything goes right. Your p99 is what happens when you have a traffic spike, a long system prompt, or a model provider having a bad afternoon. That's the number your worst-off users are experiencing right now.
Databricks' post on reliable LLM inference at scale is explicit about this: the most demanding agentic applications cannot afford for p95 TTFT and output tokens per second to degrade. They're not tracking averages — they're tracking tail behavior because that's where reliability contracts get violated.
The tail is also where the cost tradeoffs get real. TTFT scales with prompt length — General Compute's guide notes that TTFT for a 200-token prompt versus a 20,000-token prompt can differ by an order of magnitude on the same hardware. So the team that stuffed 8,000 tokens of context into every system prompt is also the team whose p99 TTFT is four times worse than it needs to be. That's a prompt engineering problem masquerading as an infrastructure problem.
The practical benchmark data reinforces this. Testing across five LLM APIs found Claude Haiku 4.5 delivering its first token in 597ms on a medium-length prompt, while GPT-4.1 Mini took roughly 2,400ms on the identical test — a 4x gap. That gap doesn't show up in your average latency if you're mixing fast and slow requests. It shows up in your p99.
What to Actually Instrument
The MLflow monitoring guide makes a point worth tattooing somewhere: set separate alert thresholds for P99 latency and turn-budget hit rate. If both spike together, the root cause is almost always a prompt regression or a newly introduced tool with high failure rates. That's a diagnostic shortcut that saves hours.
Here's the instrumentation stack I'd argue every team needs before they can claim they're actually monitoring LLM latency:
TTFT at the span level, not the request level. You need to know whether a slow TTFT is coming from queue depth (too many concurrent requests) or prompt length (your context window is doing too much work). Emre Cavunt's piece identifies queue depth as the leading indicator for both high TTFT and cascading failures — if it's consistently above zero under normal load, you're already at capacity and degrading for everyone.
P99 and P95, not just P50. Track these separately per endpoint, not aggregated across your whole service. A summarization endpoint with 8,000-token inputs has a completely different latency profile than a short-form chat endpoint. Mixing them in one dashboard hides both.
Token throughput per dollar. Databricks' infrastructure post credits cost-aware load balancing with saving over 80% in GPU costs versus static provisioning while maintaining latency targets. You can't make that tradeoff intelligently without knowing your throughput-per-dollar baseline.
The cost angle matters here in a way teams often miss. I wrote about token-level cost tracking a few weeks ago. Latency and cost are coupled: the same prompt length that blows up your p99 TTFT is also the one burning your token budget. Fixing one often fixes both.
The teams that get this right aren't running fancier infrastructure. They're measuring at the right granularity, tracking the right percentile, and treating TTFT as a first-class SLO rather than a footnote in their observability dashboard.


