The incident report from a real Friday-night production failure reads like a horror story in slow motion: a customer support agent launched Monday, by Friday the inbox was full of complaints, and the on-call engineer had no idea where to start. The engineering team was treating it as one big problem. It was actually four problems stacked on top of each other — and none of them showed up in the latency charts.
That's the thing about LLM quality degradation. Your infrastructure metrics look fine. Your error rate is clean. Your p95 latency is holding. And your model is confidently generating garbage for a subset of users who haven't complained yet.
Debugging this without a plan costs you two things simultaneously: time chasing the wrong failure mode, and money running evals at full scale on every trace trying to find the signal.
Your APM Dashboard Is Measuring the Wrong Thing
Traditional monitoring tells you whether a request succeeded. It cannot tell you whether the answer was correct. As LangChain's observability team frames it: an agent can have 99% uptime and still fail to follow user intent. A 200 OK with acceptable latency is not evidence of a good output.
This is the gap that burns teams. They instrument their LLM pipeline the same way they'd instrument a REST API — track errors, track latency, set up alerts — and then wonder why users are complaining about quality while the dashboard shows green.
The fix isn't more dashboards. It's a different category of signal entirely. Braintrust's monitoring team puts it plainly: LLMs hallucinate, miss context, and produce inconsistent outputs. A customer-facing assistant might work perfectly in testing but start generating incorrect product recommendations in production when users ask unexpected questions. The only way to catch that is running quality evaluation — automated scoring on sampled production traffic — not watching error rates.
The practical implication: before you can debug quality issues, you need traces that capture inputs, outputs, and intermediate steps, plus at least one automated scorer running on a sample of live traffic. Without that, you're doing forensics on vibes.
Start With Traces, Then Narrow the Failure Mode
When quality does drop, the instinct is to start tweaking the prompt. Resist it. The forensics order that actually works starts with traces: pull a failing request, look at where time is being spent, and identify what's actually breaking before touching anything.
The most common production failure isn't a bad prompt. It's an external dependency that got slower or less reliable — a retrieval index that grew without re-tuning, a tool API that started rate-limiting, or a model provider that pushed a quiet checkpoint update. In the Friday-night incident above, the LLM provider had pushed a silent model update mid-week. The new checkpoint interpreted the routing prompt differently, causing the agent to loop more often before settling on an answer. Average iterations went from 2.3 to 4.1. Cost and latency both jumped — but the root cause was invisible until someone looked at the trace.
The diagnostic: check tool latency and error metrics for the past week. If any tool's p95 latency has doubled since launch, or its error rate has ticked up meaningfully, that's your candidate. Fix the dependency before touching the prompt.
Only after ruling out external degradation do you look at the prompt and validation layer. And when you do look at validation, check whether your gates are actually firing — not just whether they exist. The same incident surfaced a faithfulness threshold set at 0.7 that was letting bad outputs through. The gate existed. It wasn't catching the failures it was supposed to catch.
The Budget Problem Is a Sampling Problem
Here's where teams blow their debugging budget: they turn on full eval coverage when something breaks, then forget to turn it off. Token costs compound fast — a single poorly optimized prompt can multiply costs by 10x, and running expensive evaluators on every production trace is its own cost spiral.
The pattern that works is tiered sampling. Run cheap heuristic checks (length, format, refusal detection) on 100% of traffic. Run a mid-cost automated scorer — faithfulness, relevance, something model-graded — on 10-20% of traffic. Reserve expensive human review or adversarial eval for traces that failed the cheaper checks or that users flagged explicitly. LangSmith's approach of saving real-world failure examples as test cases is the right instinct here: production traces that expose new failure modes become your next eval dataset, not just incidents to close.
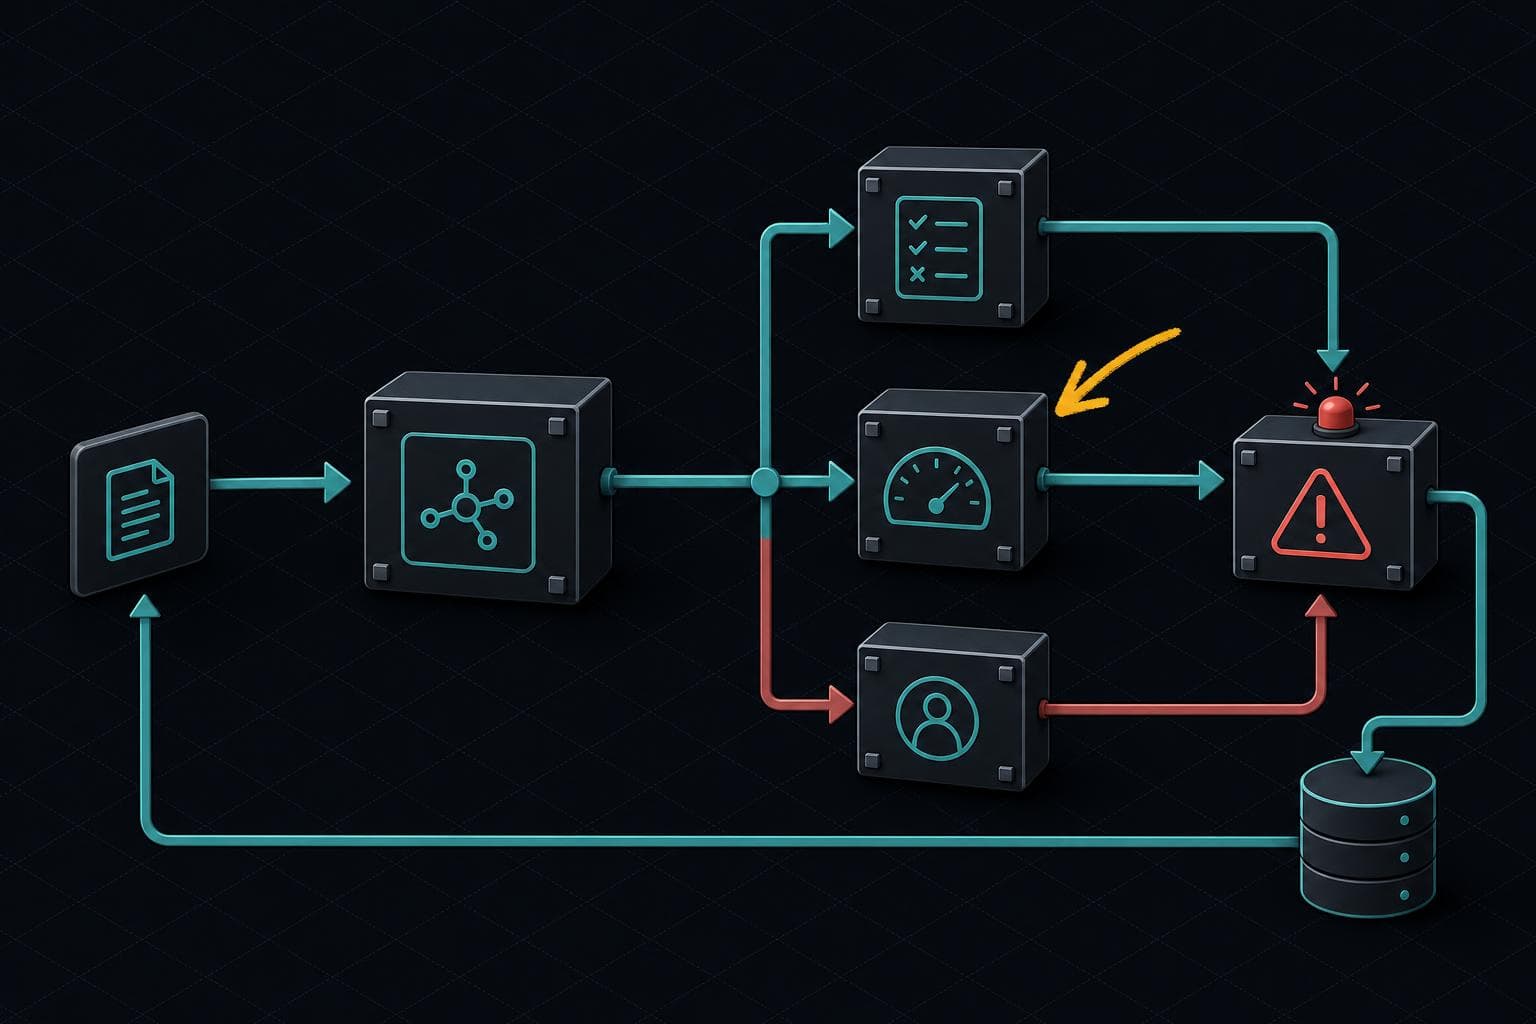
The goal is a continuous loop: sample production traffic → score outputs → surface quality drops → trace the failure → fix the root cause → add a regression test. Confident AI's framing is that evaluation is the observability — not a separate step you run before launch and then forget about.
That loop doesn't have to be expensive. It has to be running.
Next week: We're getting into prompt versioning — specifically, what happens when your prompt management system doesn't exist yet and you're tracking changes in a shared Notion doc. The failure mode is predictable. The fix is less painful than you think.


