The support ticket reads: "The AI feels slow and dumb lately." No stack trace. No error code. Just a user who noticed something your dashboards didn't.
This is the failure mode that keeps me up at night — not the 500 error that pages your on-call rotation at 2am, but the quiet degradation that accumulates over days while every health check stays green. A post from ML engineer Sebastian Buzdugan published earlier this month describes it precisely: latency is fine, costs are flat, no 4xx spikes. From the outside, everything looks healthy. Inside, quality is sliding.
The problem is that LLMs fail without throwing errors. A response that takes 12 seconds instead of 3 still returns HTTP 200. A model that's started hedging every answer still returns HTTP 200. Your traditional monitoring infrastructure was built to catch crashes, not drift.
P50 Latency Is a Lie You're Telling Yourself
The first mistake most teams make is monitoring average or median latency and calling it done. P50 tells you what's happening to your typical request. It tells you nothing about the tail — and for LLM workloads, the tail is where the user experience actually lives.
A user who hits a 45-second response on a document summarization task doesn't care that your P50 is 3.2 seconds. They've already closed the tab.
Datadog's AI observability documentation makes the point directly: metrics like uptime, latency, and error rates still matter, but they cannot tell teams whether an AI system's output is correct, grounded, safe, or useful. A system can appear healthy while quietly producing misleading results. Latency is the one signal that bridges the traditional monitoring world and the AI-specific one — it's measurable with standard tooling, but it requires AI-aware decomposition to be actionable.
That decomposition matters because "latency" in an LLM pipeline isn't one number. It's at least three: time to first token (TTFT), time per output token, and total response time. A spike in TTFT usually points to infrastructure — cold starts, provider-side queuing, context window overhead. A spike in tokens-per-second often points to the model itself or to prompt changes that shifted output length. Treating them as the same metric means you'll spend hours debugging the wrong layer.
You Can't Attribute What You Haven't Traced
Here's the operational reality: if you're not running distributed tracing on your LLM pipeline, you're flying blind on latency attribution. You know the response took 8 seconds. You don't know whether the LLM took 7 of those seconds or whether a tool made three retries before timing out.
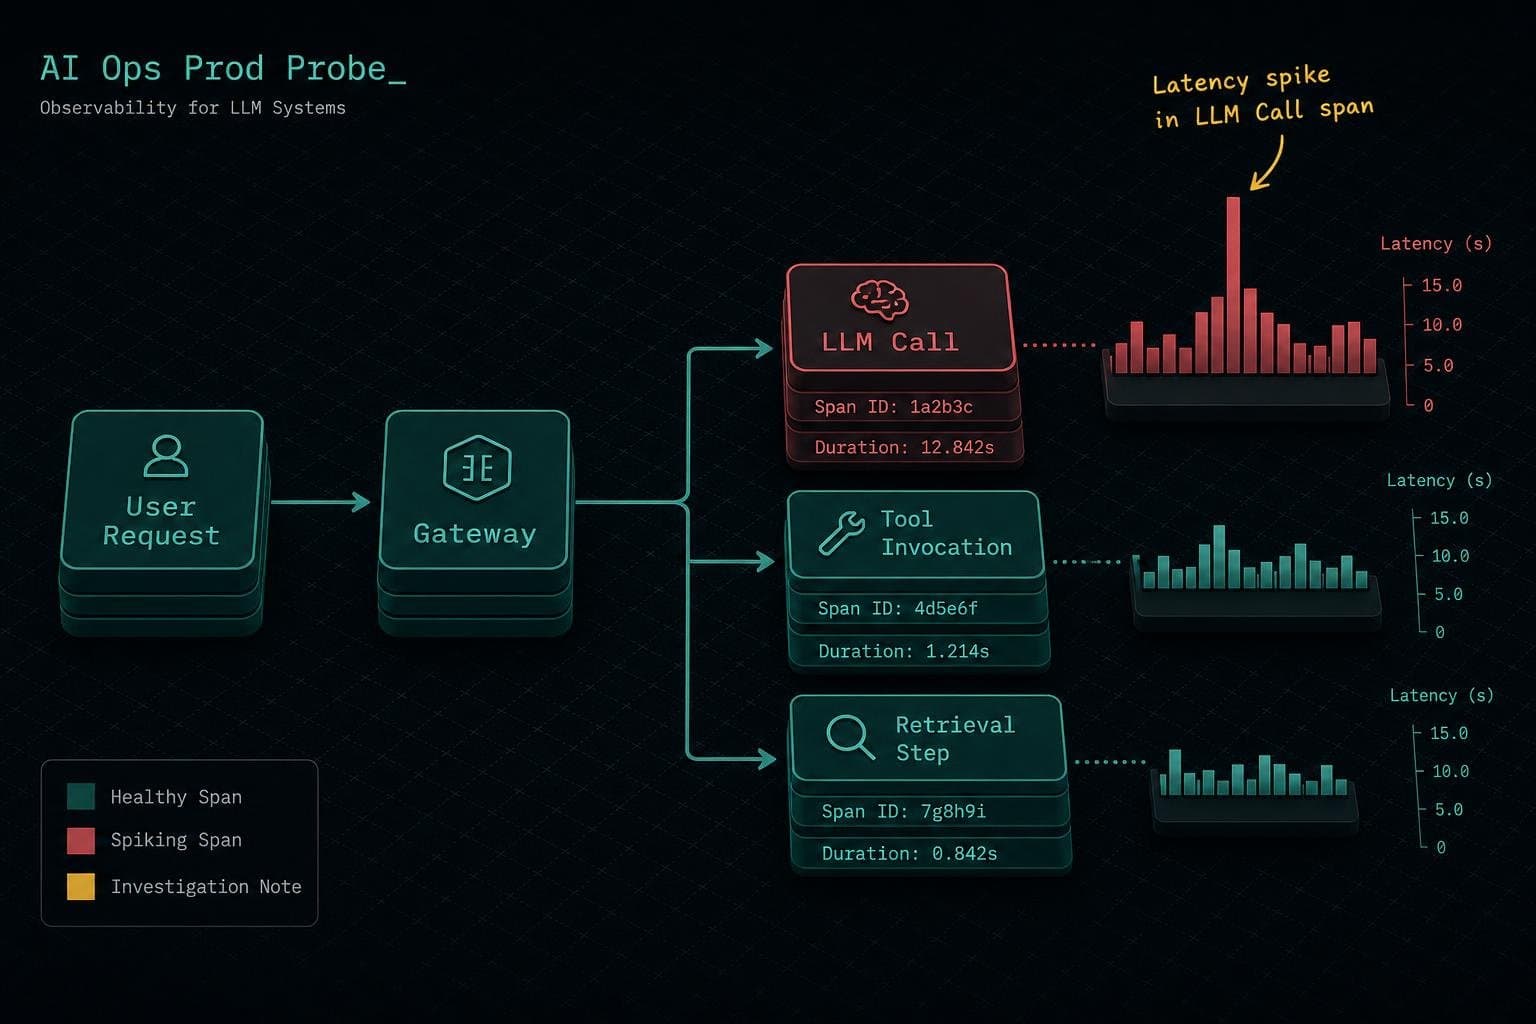
A DEV Community post on production agent monitoring puts it plainly: without distributed tracing, you see none of the internal structure. That one user message becomes ten or more internal operations — LLM calls, tool invocations, retrieval steps, retries — and the latency could be hiding in any of them.
The OpenTelemetry GenAI semantic conventions give you the instrumentation vocabulary to fix this. Stable span attributes like gen_ai.usage.input_tokens, gen_ai.usage.output_tokens, and gen_ai.request.model let you correlate latency against prompt size, model version, and provider — the three variables most likely to explain a regression. The agent-specific extensions (gen_ai.tool.name, gen_ai.agent.name) are still marked experimental as of early 2026 but are implemented by the major libraries and stable enough to build on.
Datadog's practical guide to monitoring LangGraph agents shows what this looks like in practice: flame graphs that visualize full agent runs, with request latency and token consumption tracked at the span level so you can isolate whether a latency spike came from the LLM call, the tool execution, or the retrieval step. That's the difference between a 2-minute diagnosis and a 2-hour one.
Build the Alert That Fires Before Users Do
The goal isn't just visibility — it's early warning. By the time a user files a support ticket about slowness, you've already lost the window to catch the regression at its source.
The n8n observability guide identifies time to first token as a critical system performance metric precisely because it's the latency signal users feel first. A TTFT alert at 1.5x your baseline — before P99 total latency has moved — gives you a leading indicator rather than a lagging one.
Pair that with a prompt-change audit trail. In my experience, the most common source of latency regressions isn't provider infrastructure — it's a prompt that got 400 tokens longer last Tuesday. MLflow's 2026 observability guide frames cost-quality correlation as a first-class UI requirement for exactly this reason: you need to see latency and prompt changes in the same view, not in separate dashboards that require manual cross-referencing.
The monitoring stack that actually works at 2am is the one where a latency spike surfaces a trace, the trace shows which span spiked, and that span links back to the prompt version that changed. Everything else is just expensive logging.


